By: Marlena Schugt
Introduction
Twenty-nine people were killed in the first weekend of August 2019 by legally obtained AK-47-style rifles (Thomas, 2019). First, a shooting in El Paso at a local Walmart, and then nearly 15 hours later, a shooting in a popular business district in Dayton, Ohio (Thomas, 2019). Those wounded ranged in age from 2 to 82 years old (Thomas, 2019). 2019 was plagued with mass shootings. It seems that almost every week we hear in the news about another. In fact, some media outlets are claiming there was a mass shooting every day in 2019 (Silverstein, 2019). But it is not only 2019 that has been scorned with the deaths of the innocent in society, because this has been a problem in the United States for years.
Before even conducting any research, the names of mass shootings have been forever ingrained into our minds. When we think of Columbine, Virginia Tech, Parkland, Sandy Hook, Las Vegas, San Bernardino, Aurora, Orlando, The Tree of Life, and now El Paso and Dayton, it’s impossible not to think of how many lives ended and how many were forever changed due to mass shootings in the United States. These are not events occurring in a single area of the country; they’re everywhere, at our movie theaters, concerts, malls, places of worship, shopping centers, and even schools. It is for this reason that discussions have ignited determining potential modifications to the current state and federal gun legislation to prevent further tragedy.
This research looks to determine what influences the number of mass shootings in a state. By doing so, perhaps we can determine conditions that contribute to areas with fewer mass shootings in order to save American lives.
Every state is vastly different, but by analyzing a state’s ideology, gun legislation, mental health capacity, and the population’s proximity to mass shootings, a pattern is expected to emerge which can help depict the conditions of a state which can breed or hinder occurrences of mass shootings. To study state ideology, the residents’ political campaign contributions in each state and the party in control at various state levels will be studied. Gun regulations will be studied, along with the mental health ranking of each state. In addition, the number of mass shootings and the population density of a state will be examined to determine how proximity plays a role. There are five hypotheses in this study to better understand the factors leading to mass shootings and deaths by firearms:
- States with more Democratic campaign contributions have fewer mass shootings and deaths by firearms,
- States with Republican control of the government have more mass shootings and deaths by firearms,
- States with less strict gun control laws have more mass shootings and deaths by firearms,
- States with a lower mental health ranking will have more mass shootings and deaths by firearms,
- States with a high population density have fewer mass shootings and deaths by firearms.
To understand what other factors could influence the number of mass shootings in a state and to see where the factors studied within this research were taken from, previous research must be examined. This also helps to place the research within the discourse of preventing mass shootings.
Literature Review
Robert Richards (2017) from Duke University investigated if there is an independent relationship between organized and latent group behavior and legislative behavior. He wanted to uncover if the media portrayal of interest groups holding the most power over elites was correct or whether there are other forces that influence decision making in the US House of Representatives (Richards, 2017). By using representatives instead of senators, Richards hoped to study politicians who have the election at the forefront of their minds, as they are up for reelection every two years (Richards, 2017). He studied organizational groups by focusing on the National Rifle Association (NRA) and their campaign contributions and studied latent groups by studying the number of hunters in a district (Richards, 2017). Hunters are classified as a latent group because they are most likely gun owners and interested in gun policy, but they are not necessarily organized members of the NRA (Richards, 2017).
Ultimately, Richards concluded that latent groups, such as the hunters, and organized groups, such as the NRA, independently influence legislative behavior (Richards, 2017). The number of hunters in a district is directly correlated with a representative being less likely to co-sponsor a gun control bill (Richards, 2017). However, the NRA does not only give contributions to those who represent districts with large populations of hunters (Richards, 2017). This is essential to support the research conducted in this paper because it displays the influences that organized interest groups actually have compared to groups that exist and influence legislative behavior but don’t organize. The concept can be applied amongst other latent sub-constituencies, or constituency groups, such as LGBT, African-American, and senior communities (Richards, 2017). This research is utilized by measuring campaign contributions in each state which are largely influenced by the power of interest groups and elites to meaningfully organize the people behind a shared cause.
In addition to interest groups and latent groups influencing gun legislation, the main political parties of the country also play a role. The main thesis of the article, “Crime And Partisanship: How Party ID Muddles Reality, Perception, And Policy Attitudes On Crime And Guns,” is that our ideas of partisanship and our political party identity create a sense of how we see our lived environment and interpret events that happen (Pearson & Dyck, 2017). It investigates if the geographic location and the party identification of a person work simultaneously to produce an opinion on gun control (Pearson & Dyck, 2017). They used crime statistics from the FBI and original surveys to study American adults and their gun control attitudes (Pearson & Dyck, 2017). They found that people resist the information from their lived environment when they have strong partisanship, in regard to gun control (Pearson & Dyck, 2017). Democrats and Republicans have very different views on gun control but it is not because of their geographic location and experiences, but rather through other factors, such as influence from the party (Pearson & Dyck, 2017). Independents tend to be more influenced by their lived experiences than any one party (Pearson & Dyck, 2017). This article is very useful because it will help explain why some states have different gun control laws than others. This article suggests that gun regulation contributes to the party in control and that lived experiences create a different outcome for respective parties, especially for people who have strong partisanship. This article also supports my research by suggesting that geography plays a role in determining attitudes toward gun control. This concept will be expanded on by exploring population density and its relationship with mass shootings.
Despite this research directed at studying mass shootings, it is very hard to determine an exact definition for the term. In fact, Andrew Smith and Michael Hughes discuss in The Wiley Handbook of Psychology the challenges met when trying to empirically investigate mass shootings (Smith and Hughes 2016). In fact, they describe the term mass shootings as more “of (a) convenience than a scientific concept” (Smith & Hughes 2016, p. 3). This is because there is no standard of how many victims are necessary to be deemed mass and there are no boundaries concerning shooting (Smith & Hughes, 2016). When speaking on shootings, it is implied that someone has been injured or killed, but this is limiting if we wish to study psychological effects shootings have (Smith & Hughes, 2016). The term shooting is also too broad in the sense that there are no guidelines to determine if mass shootings are only deemed public, if we should consider those in the private realm, or if homicide-suicides, gang-related violence, or robberies should also be tallied (Smith & Hughes, 2016). Because of these discrepancies and the lack of definition for mass shootings, the research conducted here will also take deaths by firearm per 100,000 people in each state into account. The deaths by firearms will be connected to mass shooting rates while also encompassing more broad data.
Reading “The Direct and Moderating Effects of Mass Shooting Anxiety on Political and Policy Attitudes” by Joslyn and Haider-Markel (2018) gives a background on how anxiety surrounding mass shootings impacts one’s political ideology and their attitude on policy. Joslyn and Haider-Markel (2018) hypothesized that people who have anxiety because of mass shootings will seek protection from the unpredictability and perceived threats. They found this to be true by studying US adults after the nightclub shooting in Orlando (Joslyn & Haider-Markel, 2018). Anxiety had less of an effect on liberals who already supported gun control measures but caused tension between conservatives because they had not previously supported gun control policies (Joslyn & Haider-Markel, 2018). However, their anxiety about the issue had an effect and made many conservatives support restrictions on guns (Joslyn & Haider-Markel, 2018). They also found that anxiety caused conservatives to blame terrorism and liberals to blame access to guns, but both blamed mental illness (Joslyn & Haider-Markel, 2018). Overall, they found that high-anxiety individuals are less polarized than individuals not impacted by this anxiety (Joslyn & Haider-Markel, 2018). Further research could indicate whether districts, counties, or states with more mass shootings have more strict gun laws and less political polarization. This article is a keystone for my research because it shows that fear from mass shooting events affects people’s views on gun legislation more than political ideology.
Newman and Hartman (2017) conducted a study concerning the proximity to a mass shooting and how that can affect one’s attitude about gun control. Their theory was that residing near a mass shooting should increase support for gun control because gun violence is a more salient issue to the community they live in (Newman & Hartman 2017). Their idea was that one knows the places and the people around them which makes this a “real issue” and impacts them more than just hearing about a mass shooting across the country through the news and social media (Newman & Hartman, 2017). Their hypothesis was confirmed after studying responses from the Cooperative Congressional Election Study (CCES), when they found that increased proximity is related to a high association for stricter gun control (Newman & Hartman, 2017). They found this did not vary by partisanship but was rather impacted by repeated events, the magnitude of events (number of victims), and the recency of events (Newman & Hartman, 2017). They found on average that every American resides 84 miles away from a mass shooting (Newman & Hartman, 2017). However, the standard deviation for this data is 112 miles and the range goes from 0 to 870 miles away from a shooting (Newman & Hartman, 2017). This means 68.4% of the US population lives within 112 miles of a mass shooting.
This article helps this research because they are also looking to discover why public opinion fails to address mass shooting incidents in a way that would prevent them entirely in the future. Perhaps the reasons for states having differing gun control laws is because they have a decreased number of incidents, or maybe a majority of citizens live far enough away from one of these tragedies that they can put it out of their mind. This article directed my research toward population density to help explain if states with more dense populations have fewer mass shootings because they are more connected with their community than those with more dispersed populations.
Theory and Hypothesis
Following the research that has been conducted to describe how people form their opinions on gun control, this research will explore the intricacies of that relationship to determine if ideology, gun laws, mental health concerns, and proximity to mass shootings play a role in how many mass shootings occur in a state.
One hypothesis to be tested is whether states with more Democratic campaign contributions have fewer mass shootings and deaths by firearms. Democratic Party candidates tend to be more liberal in ideology and that correlates with stronger support of gun control. If Democratic campaigns are receiving more money, the population that is donating is more likely to support gun regulations which can potentially stop mass shootings and firearm deaths.
An additional hypothesis to be studied is if states with Republicans in control of the government have more mass shootings and deaths by firearms. This hypothesis comes from the research conducted by Pearson and Dyck (2017) concerning latent and organized groups. This hypothesis studies the organized groups, Republicans, while the first hypothesis looks at latent groups, liberal elites.
Another hypothesis to be tested is to see if states with less strict gun control laws have more mass shootings and deaths by firearms. This hypothesis will be tested using the Gun Law Scorecard provided by the Gifford’s Law Center in 2018, where states with stronger laws concerning guns received better grades on the scorecard. This was chosen because it is a more comprehensive approach compared to looking at past and present gun regulations in a state. By studying this hypothesis, this research hopes to show that more gun regulation means fewer mass shootings and deaths by firearms because of the limited access.
The next hypothesis concerns mental health. It asserts that states with a lower mental health ranking will have more mass shootings. The idea behind this is that states that allow people with mental health issues to remain undiagnosed or untreated while having access to guns, will experience more mass shootings and deaths by firearm in that state.
The final hypothesis is that states with a high population density have fewer mass shootings and deaths by firearms. This hypothesis investigates the proximity one has to a mass shooting. This is influenced by the research conducted by Newman and Hartman (2017) which explains that people closer to shootings have greater support for gun control. If there is a higher percentage of people living closer together in a state, there is a greater chance they will experience some emotional toll of being near a shooting and therefore vote in favor of politicians and policies which are stronger in regulating guns.
Upon testing these hypotheses, there will be an explanation regarding the relationships between ideology, mental health conditions, proximity, strength of gun control laws, and the number of mass shootings and deaths by firearms in a state.
Data
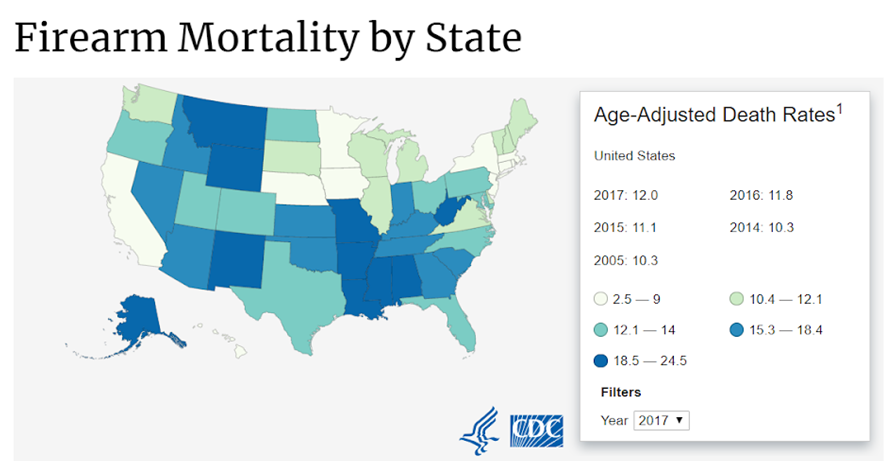
In order to properly study mass shootings, there must be a standard definition on which to base the research. However, there is not. It makes studying mass shootings within states very difficult as there is not a clear record of them that exists. Therefore, this study relies on the definition provided by Mother Jones that a mass shooting is a public shooting that occurs with more than 4 casualties (Follman et al., 2019). This definition excluded armed robberies and gang violence. Because there is uncertainty about the accuracy of the mass shooting numbers, this study also relies on deaths per firearms numbers which are provided by the Centers for Disease Control and Prevention (CDC). These numbers include any firearm mortality that occurs within a state. After distinguishing the two dependent variables, number of mass shootings and deaths per firearm, the study can continue with studying the independent variables of ideology, gun regulations, mental health, and proximity. The data for deaths by firearms is visually represented in Figure 1, which displays states with more deaths by firearms per 100,000 in darker colors.
Figure 1
To operationalize ideology which exists in a state, this study determined which parties were in power in the state at the lower and upper house levels of the state legislature as well as which party was in power in the executive branch. This information came from Ballotpedia.org, which is a non-partisan online political encyclopedia (“Partisan Composition of State Legislatures,” n.d.). This study also examined political party campaign contributions reported by the Federal Elections Committee (FEC) to determine which party the people in the state give the most money to. The data used in this study from the FEC was made more accessible by the Center for Responsive Politics (“Get Local!,” n.d.). This can reflect the ideology of the elites who arguably have the most influence on policy in a state (Gilens & Page, 2014).
To determine the mental health status of a state, this research uses the mental health ranking provided by Mental Health America. They ranked states based on 15 factors including the number of adults and youths with any mental illness, the number of adults and youths who did not or could not receive treatment, and the availability of a mental health workforce (“Overall Ranking,” n.d.).
To analyze proximity to a mass shooting, US Census data from 2010 was explored, which determined the percentage of the population per state which lives in urban and rural areas (US Census Bureau, 2018). The concept is that in states with higher urban percentages, the population is likely to be closer to a mass shooting than in states with more rural areas because the people would be further apart. The average number of people per square mile of each state was also used to operationalize proximity, but the presence of major cities within states is why the urban and rural populations were included (US Census Bureau, 2018).
Methods
The first hypothesis was tested first through finding the net campaign contributions by subtracting the percentage of Democratic campaign contributions from the Republican percentage of campaign contributions. This means that those with a negative percentage have more Democratic Party campaign contributions than Republican Party campaign contributions. Those states with a positive percentage have more Republican Party campaign contributions. This independent variable was then tested against the dependent variables of the number of mass shootings and deaths by firearm per 100,000 people. The deaths by firearm statistic was provided by the CDC in 2017 (“Stats of States – Firearm Mortality,” 2019). This test was conducted with descriptive statistics in the form of a scatter plot as well as a regression table. In the regression table, the accepted value for significance with one tail was .05 and .10 for two-tailed. This means that if the significance is higher for either of these, the hypothesis can be rejected because there is just too high of a chance that it is wrong and occurred randomly. That standard is what all the following findings were held to as well.
In order to test the second hypothesis that states with Republicans in control of the government have more mass shootings and deaths by firearms, the party in control of the government had to be operationalized. The party in control for each level of government (lower house, upper house, and executive) was codified and compiled. Individual levels of state government were examined in addition to the state government as a whole. Upon doing so, a difference of means analysis was conducted using the t-test. This indicates if there is a correlation between the independent variable, in this case the, party in control, and the dependent variables, which are the number of mass shootings and the deaths from firearms. A larger difference in mean deaths and shootings between cases with Republican versus Democrat control suggests this factor and the shootings have a relationship.
The third hypothesis is that states with less strict gun control laws have more mass shootings and deaths by firearms. For this to be tested, there had to be a conversion of the grades from the Gun Law Scorecard from letters into statistically analyzable numbers. Therefore, states with better grades on the scorecard were given lower numbers, and states with worse grades were given higher numbers. This coding ranges from 1 to 15. Upon making this distinction, the independent variable was studied using descriptive statistics in the form of a scatter plot as well as through a regression table. This allows the data to be easily visualized as well as statistically supported.
The fourth hypothesis is that states with a lower mental health ranking will have more mass shootings and deaths by firearms. The data utilized was from Mental Health America in the form of a scatter plot and regression table, very similar to the methods used for hypothesis three.
The fifth and final hypothesis is that states with a high population density have fewer mass shootings and deaths by firearms. This hypothesis was studied with both data from the US Census on the density of states and also the net urban-rural percentage of states. This final hypothesis was tested the same way as hypotheses three and four: with a scatter plot and regression table.
Analysis and Findings
Hypothesis 1
It was discovered when testing the relationship between state ideology and number of mass shootings with the scatter plot that when there were more total Democratic campaign contributions across the state in the 2017-2018 election cycle there were more mass shootings. However, in the regression table pictured in Table 1, we can see that this finding is statistically insignificant with a value of .38. Upon rejecting this finding, the data is studied concerning deaths by firearms.
Table 1: Number of Mass Shootings (1982 – August 2019) Coefficients
| B | Std. Error | t | Significance | |
| Constant | 2.698 | .493 | 5.47 | .00 |
| Net (Republican % contributions – Democratic contributions) | -.014 | .015 | -.89 | .38 |
When analyzing the relationship between state ideology and death by firearm, it is found that as there are more Republican contributions in a state, there are also more deaths by firearms. Using the regression analysis in Table 2, it is found that this relationship is weak, because of its R Squared value. The R Squared relationship is considered weak at .0, moderate at .2, and strong when it is above .3. This test is statistically significant with a value of .00. The B value, or slope, of the line in the scatter plot is .11 which can be translated to mean that for every 10% increase in Republican campaign contributions, there is one more death by firearm per 100,000 people.
Table 2: Deaths by Firearms per 100,000 people in 2017 Coefficients
| B | Std. Error | t | Significance | |
| Constant | 13.73 | .58 | 23.71 | .00 |
| Net (Republican % contributions – Democratic contributions) | .11 | .02 | 6.05 | .00 |
Following this analysis, we accept our hypothesis concerning deaths by firearms and net contributions but reject our hypothesis concerning the number of mass shootings and net contributions.
Hypothesis 2
For the next hypothesis, the t-test is used. First, this study looked at unified Democratic, divided, and unified Republican state governments to learn which system had, on average, the most mass shootings. It was found, as shown in Table 3, that when there were Democrats in control, there were more mass shootings. However, this finding is rejected because it is statistically insignificant with a value of .274.
Table 3: Number of Mass Shootings (1982 – August 2019) Descriptives
| N | Mean | Std. Deviation | |
| Democratic Control | 14 | 3.93 | 5.05 |
| Divided | 13 | 1.85 | 1.46 |
| Republican Control | 23 | 2.48 | 3.04 |
Significance =.274
When conducting analysis on how party control of government affects the number of deaths by firearms, it is found that states with Republicans in unified control have an average of 16.32 deaths. This is much more than the states with Democratic unified governments, which have an average deaths per firearms rate of 9.69. The relationship here is statistically significant with a value of .00 as shown in Table 4.
Table 4: Deaths by Firearms per 100,000 people in 2017 Descriptives
| N | Mean | Std. Deviation | |
| Democratic Control | 14 | 9.69 | 5.01 |
| Divided | 13 | 12.81 | 5.03 |
| Republican Control | 23 | 16.32 | 4.21 |
Significance =.00
The levels of state government were also analyzed individually in terms of the executive branch and the legislatures’ lower and upper houses. Similar relationships were found at all three levels. The relationship was that when Democrats were in control, there were more mass shootings. However, at each level, the finding was statistically insignificant and therefore rejected. The findings are shown in Table 5.
Table 5: Number of Mass Shootings (1982-August 2019) Oneway T-test
| N | Mean | Std. Deviation | T | Significance | |
| Republican Executive | 27 | 2.26 | 2.89 | 1.02 | .32 |
| Democratic Executive | 23 | 3.26 | 4.06 | 1.02 | .32 |
| Republican Lower House | 31 | 2.42 | 2.71 | .78 | .44 |
| Democratic Lower House | 19 | 3.21 | 4.50 | .78 | .44 |
| Republican Upper House | 32 | 2.41 | 2.66 | .849 | .40 |
| Democratic Upper House | 18 | 3.28 | 4.63 | .849 | .40 |
In contrast, it was discovered that when Republicans were in control at any level, there were more deaths by firearms. These findings were statistically significant and are shown in Table 6.
Table 6: Deaths by Firearms per 100,000 people (2017) One Way T-test
| N | Mean | Std. Deviation | T | Significance | |
| Republican Executive | 27 | 15.32 | 4.78 | -2.67 | .01 |
| Democratic Executive | 23 | 11.48 | 5.38 | -2.67 | .01 |
| Republican Lower House | 31 | 15.99 | 4.29 | -4.99 | .00 |
| Democratic Lower House | 19 | 9.58 | 4.57 | -4.99 | .00 |
| Republican Upper House | 32 | 15.74 | 4.44 | -4.56 | .00 |
| Democratic Upper House | 18 | 9.66 | 4.69 | -4.56 | .00 |
Because of this data presented, the second hypothesis that states with Republican control of the government have more deaths by firearms is accepted. The hypothesis that states with Republicans in control of the government states will have more mass shootings is rejected.
Hypothesis 3
The third hypothesis that states with less strict gun control laws have more mass shootings and deaths by firearms was tested through descriptive statistics in the form of a scatter plot and a regression table. The scatter plot (Figure 2) shows a relatively weak relationship with an R Squared of .08. On the regression table (Table 7) we see that the relationship of states having less strict gun laws being correlated with more mass shootings is statistically significant.
Figure 2
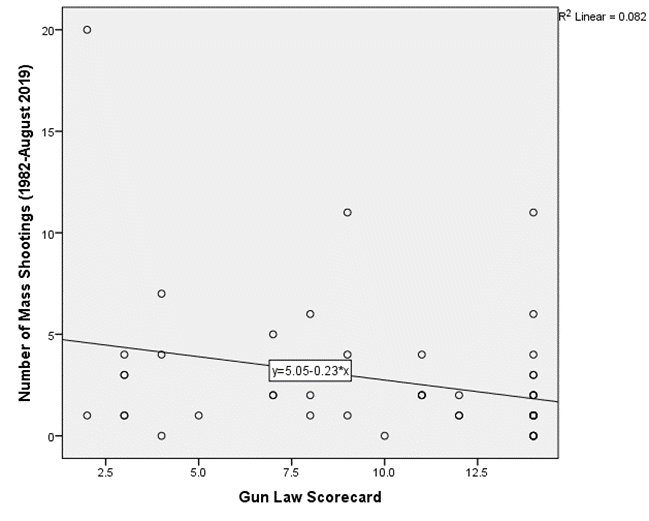
Table 7: Gun Law Scorecard Coefficients
| B | Std. Error | t | Significance | |
| (Constant) | 5.05 | 1.22 | 4.13 | .00 |
| Gun Law Scorecard | -.23 | .11 | -2.07 | .04 |
Next, to continue studying the second hypothesis, the same was done with the dependent variable of deaths by firearms. In Figure 3, there is a correlation between less strict gun laws and deaths by firearms. States with lenient gun laws have a lower ranking on the Gun Law Scorecard and a higher number in this analysis, and they experience more deaths by firearms. This is statistically supported in Table 8 where the R Squared shows a very strong relationship with a value of .62 and a significance of .00.
Figure 3
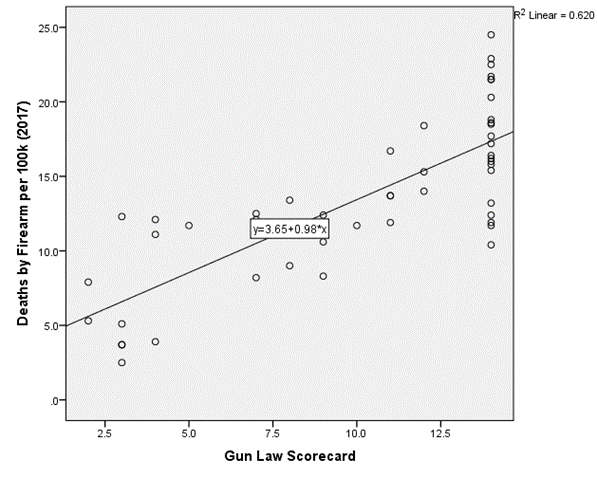
| B | Std. Error | t | Significance | |
| (Constant) | 3.66 | 1.21 | 3.01 | .00 |
| Gun Law Scorecard | .98 | .11 | 8.85 | .00 |
Because of these findings, we can reject that states with stricter gun laws have a correlation with fewer mass shootings, but we can accept that states with more strict gun laws have fewer deaths by firearms.
Hypothesis 4
Hypothesis 4 says that states with a lower mental health ranking will have more mass shootings and deaths by firearms. To test this, the study looks at a scatter plot as well as a regression table. Figure 4 shows that there is not a distinguishable relationship between the number of mass shootings and the state’s mental health ranking. In fact, the R Squared is .00 meaning there is no relationship between the variables. This finding is also insignificant as shown in the regression table (Table 9).
Figure 4
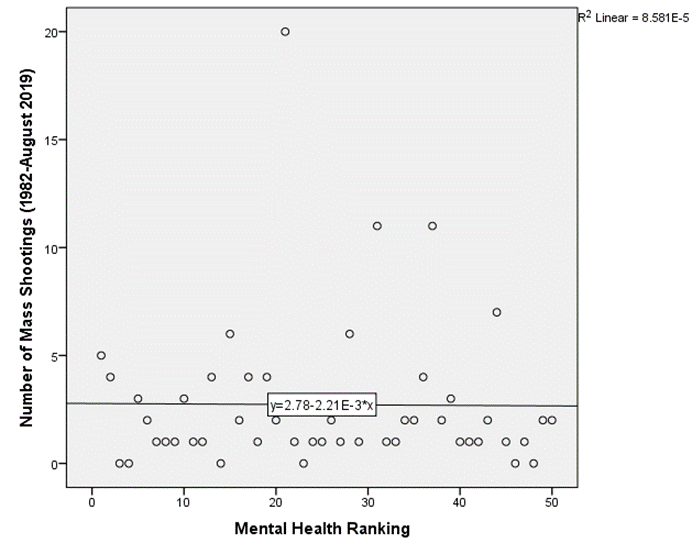
Table 9: Mental Health Ranking Coefficients
| B | Std. Error | t | Significance | |
| (Constant) | 2.78 | 1.01 | 2.75 | .01 |
| Mental Health Ranking | .00 | .03 | -.06 | .949 |
Next, the study looks at the relationship between mental health ranking and deaths by firearms. Figure 5 shows there is a strong relationship between worse mental health rankings and more deaths by firearms. This is supported in Table 10 because the R Squared is .45 and the significance is .00. This means there is a strong relationship between worse mental health rankings and more deaths by firearms.
Figure 5
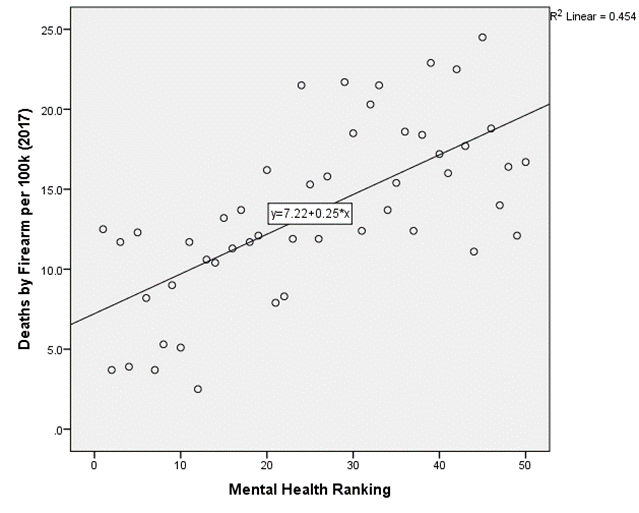
Table 10: Mental Health Ranking Coefficients
| B | Std. Error | t | Significance | |
| (Constant) | 7.22 | 1.15 | 6.27 | .00 |
| Mental Health Ranking | .25 | .04 | 6.32 | .00 |
This data proves that there is a strong relationship between having more deaths by firearms and a worse mental health ranking, therefore accepting hypothesis 4. However, the same cannot be said for the number of mass shootings, therefore that portion of the hypothesis is rejected.
Hypothesis 5
The final hypothesis says that states with a high population density have fewer mass shootings and deaths by firearms. This was tested with the net urban-rural percentage in a state as well as the population density, both provided by the 2010 US Census. In Figure 6, we see that states with a higher percentage of urban areas have more mass shootings. However, in Table 11 we see that the R Squared is weak with a value of .13. This finding is statistically significant with a value of .01.
Figure 6
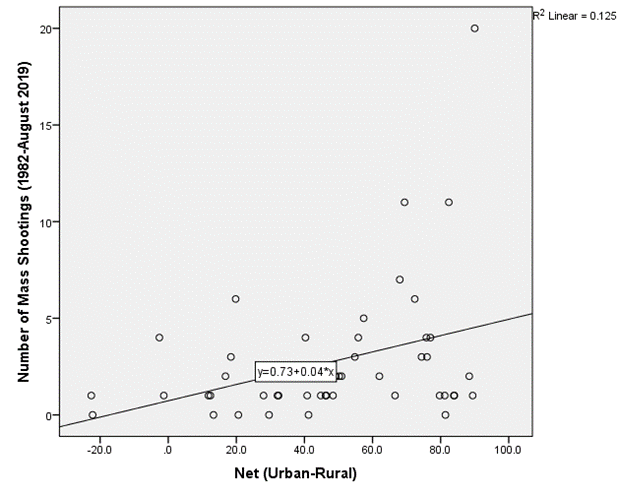
Table 11: Net (Urban-Rural) Coefficients
| B | Std. Error | t | Significance | |
| (Constant) | .73 | .89 | .82 | .42 |
| Net (Urban-Rural) | .04 | .02 | 2.62 | .01 |
This analysis was done again with net urban-rural and deaths by firearms. In Figure 7, we see there is a moderate relationship of states with more urban areas having fewer deaths by firearms. This is supported by Table 12 showing a moderate R Squared and statistical significance.
Figure 7
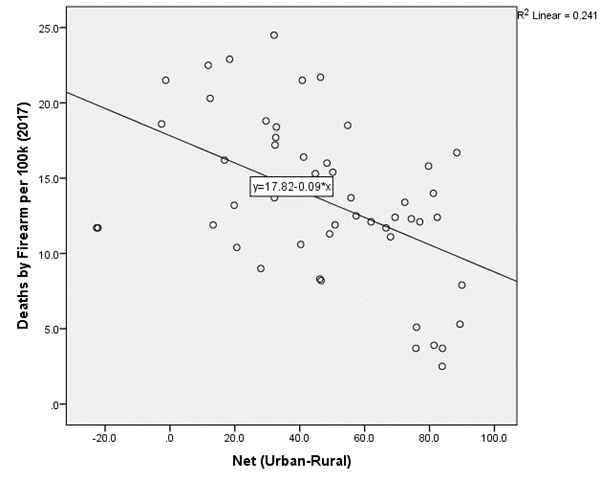
Table 12: Net (Urban-Rural) Coefficients
| B | Std. Error | t | Significance | |
| (Constant) | 17.82 | 1.28 | 13.90 | .00 |
| Net (Urban-Rural) | -.09 | .02 | -3.90 | .00 |
Next, this study looked at population density and mass shootings. Figure 8 shows no relationship between population density and the number of mass shootings. Table 13 tells us the R-Squared value is weak and the findings are not statistically significant.
Figure 8
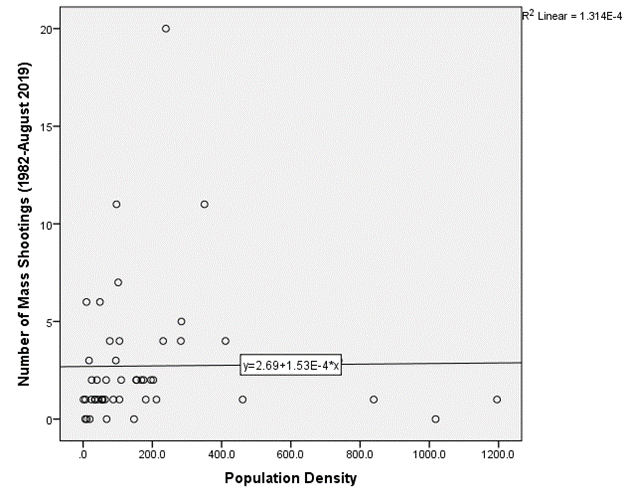
Table 13: Population Density Coefficients
| B | Std. Error | t | Significance | |
| (Constant) | 2.69 | .62 | 4.32 | .00 |
| Population Density | .00 | .00 | .08 | .94 |
When this same analysis was done while examining deaths by firearms, the findings show a strong relationship. The R-Squared value and significance for this statistical analysis mean that there is a strong correlation between having fewer deaths by firearms and a high population density, shown visually in Figure 9 and supported by Table 14.
Figure 9
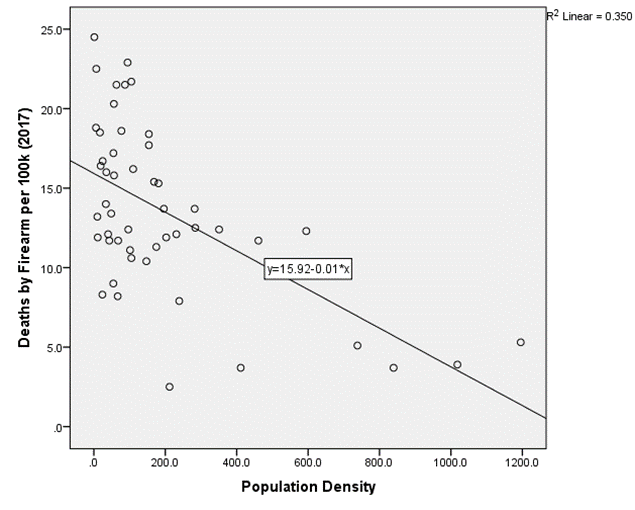
Table 14: Population Density Coefficients
| B | Std. Error | t | Significance | |
| (Constant) | 15.9 | .78 | 20.56 | .00 |
| Population Density | -.01 | .00 | -5.08 | .00 |
Through these four analyses, we can partially accept hypothesis 5. When looking at mass shootings, the data says that there is a weak, but statistically significant, relationship between more mass shootings and more urban areas. The data also shows a weak and insignificant relationship between the number of mass shootings and population density. Despite that, when looking at deaths by firearms, the data says there is a statistically strong relationship between the deaths and net urban-rural as well as population density. Therefore, we can accept that states with higher population density and greater percentage of urban area have fewer deaths by firearms, but not fewer mass shootings.
Discussion and Conclusion
This conclusion was built upon the data provided in the study described throughout this report. The investigation was influenced by research that shows that latent groups, in this case, the elites who make campaign contributions, independently influence Democrats and Republicans in office (Richards, 2017). Officials in office receiving campaign contributions from elites are expected to shape policies, including gun regulations, that are beneficial to these elites in order to continue receiving funding for future election campaigns. The investigation also supports the work by Joslyn and Haider-Markel (2018), because it shows that states with low mental health rankings also have more deaths by firearms which could be influenced by poor mental health or vice versa. The research supports Newman and Hartman (2017) as well, showing that people who live closer together are less likely to have high numbers of deaths by firearms. With more people living in one area, there could be a greater fear and anxiety surrounding shootings, therefore, greater support for gun control and less access to guns.
This research tried to explain how the environments created by states deter or encourage incidents of mass shootings. However, because no one can agree on a definition, this has become nearly impossible. Therefore, this study relied on the numbers concerning deaths by firearms in a state to confirm its hypotheses. There have been many state-independent variables studied here which have influenced this number including state ideology, gun legislation, the mental health capacity of a state, and the population’s proximity to mass shootings. Through the study we have found that the ideal state for fewer deaths by firearms has the following conditions: more contributions to Democratic candidates, Democrats hold control of the government, strict gun regulations, better conditions for those diagnosed with mental health issues, and greater population density with more urban than rural areas.
This research has the ability to influence not only lawmakers but also constituents residing in states where these conditions are not met. Luckily, the United States government is fluid and has the ability to change each election. Hopefully, upon discovering these findings, lawmakers and citizens create meaningful change which is strong enough to prevent even just one more mass shooting or death by firearm.
References
“Annual Gun Law Scorecard.” Gifford’s Law Center. https://lawcenter.giffords.org/scorecard/#PA.
Follman, Mark, Gavin Aronsen, and Deanna Pan. 2019. “US Mass Shootings, 1982-2019: Data from Mother Jones’ Investigation.” Mother Jones. https://www.motherjones.com/politics/2012/12/mass-shootings-mother-jones-full-data/.
“Get Local!” Center for Responsive Politics. https://www.opensecrets.org/states/.
Gilens, Martin, and Benjamin I. Page. 2014. “Testing Theories of American Politics: Elites, Interest Groups, and Average Citizens.” Perspectives on Politics 12(3): 564–81. doi: 10.1017/s1537592714001595.
Joslyn, Mark R., and Donald P. Haider-Markel. 2018. “The Direct and Moderating Effects of Mass Shooting Anxiety on Political and Policy Attitudes.” Research & Politics 5 (3).
Newman, Benjamin J., and Todd K. Hartman. 2017. “Mass Shootings and Public Support for Gun Control.” British Journal of Political Science: 1–27.
“Overall Ranking.” Mental Health America. https://www.mhanational.org/issues/ranking-states.
“Partisan Composition of State Legislatures.” Ballotpedia. https://ballotpedia.org/Partisan_composition_of_state_legislatures.
Pearson-Merkowitz, Shanna, and Joshua J. Dyck. 2017. “Crime And Partisanship: How Party ID Muddles Reality, Perception, And Policy Attitudes On Crime And Guns*.” Social Science Quarterly 98 (2): 443-454.
Richards, Robert. 2017. “The Role of Interest Groups and Group Interests on Gun Legislation in the U.S. House*.” Social Science Quarterly 98 (2): 471–84.
Silverstein, Jason. 2019. “There Have Been More Mass Shootings than Days This Year.” CBS News.
Smith, Andrew J., and Michael Hughes. 2016. “Challenges to the Empirical Investigation of Mass Shootings.” The Wiley Handbook of the Psychology of Mass Shootings: 1–19.
“Stats of the States – Firearm Mortality.” 2019. National Center for Health Statistics. https://www.cdc.gov/nchs/pressroom/sosmap/firearm_mortality/firearm.html.
Thomas, Elizabeth. 2019. “In Bloody August Weekend, Gun Violence beyond Mass Shootings.” ABC News.
US Census Bureau. 2018. “2010 Census Urban and Rural Classification and Urban Area Criteria.” US Census. https://www.census.gov/programs-surveys/geography/guidance/geo-areas/urban-rural/2010-urban-rural.html.
US Census Bureau. 2018. “2010 Census: Population Density Data.” US Census. https://www.census.gov/data/tables/2010/dec/density-data-text.html.