By: Robert Caleb Doyle
The following will be a study into the correlation between approaches taken to sex education and the outcomes of such approaches when applied in the real world. Specifically, the research will be focused on addressing the scourge of teen pregnancy and the educational approaches taken for younger generations. The general experience from a Pennsylvania public school, which addresses sexual education in an “Abstinence First” manner, is what spurred the investigation of this topic. Society as a whole can be measured by our rate of teen pregnancy and our commitment to preventing that activity for future generations. Indeed, we are measured on the world stage by our teen pregnancy rate. It has been found that “the United States continues to have one of the highest teen pregnancy rates in the developed world, almost twice as high as those of England and Canada, and eight times as high as those of the Netherlands and Japan.” (McKee 2008).
The purpose of this research is to determine which sex education technique seems to be most effective, with effectiveness being determined by the ability of the technique to prevent occurrences of teen pregnancy, and thus contributing to the reduction of teen pregnancy rates within a geographical area. The end result of this research is to understand which sex education public policy position is most effective for the prevention of teen pregnancy. Once found, the results from this research would allow for advocacy in Pennsylvania as well as other states for specific effective sex education practices. Generally, the nation’s approach to sex education has been unprepared and ill effective. As a result, the motive now is to determine how to best prepare future generations.
Literature Review
Setting the Stage
An important facet of modern-day approaches to sex education is abstinence education, or sex education as rated by its’ emphasis on abstinence. Abstinence education can be broken down into four levels, “from least to most emphasis on abstinence: no provision, abstinence covered, abstinence promoted, abstinence stressed” (Stanger-Hall 2011). Within this breakdown, particular guidelines are imposed on schools within a state’s jurisdiction, which offers sex education teachers guidance on how to teach their courses and what they should emphasize or de-emphasize. To further break it down, these guidelines range from teaching abstinence only until marriage, promoting abstinence but discussing contraceptive options, discussing abstinence within a larger conversation of comprehensive sex education, and no discussion of abstinence along with no requirement that it be discussed (Stanger-Hall 2011).
Modern Condition
Currently, in America, “an ongoing conflict between science and ideology in US public health policy” is being witnessed (Santelli 2019). This conflict is manifested as a political issue, largely a disagreement on the level to which abstinence should be taught in schools, and what is the best way to discourage teen pregnancy. Most recently, America has seen “efforts by the Donald Trump administration to dismantle the evidence-based Teen Pregnancy Prevention (TPP) program”, which in combination with government support for “sexual abstinence-only until marriage (AOUM) programs over the past 38 years” has created a standard of abstinence controlled sex education, something that may prove not to be the best option in terms of preventing teen pregnancy (Santelli 2019).
There exists, currently, some formation of studies which support the idea that funding for abstinence driven education may not be having the intended effect upon our young people, or may have little to no effect overall. At this current moment, “a preponderance of studies have found no effect of abstinence education at reducing adolescent pregnancy or insufficient evidence to draw conclusions” (Fox 2019). Corresponding to Fox’s conclusion, McKee offers a similar review of abstinence education, saying that “evaluation studies from 13 U.S. states indicate that abstinence-only programs have not demonstrated long-term impact on teens’ sexual behavior” (2008). Given the ability of states to determine their own standards in regard to sexual education, data also exists which supports the implementation of comprehensive sex education programs that offer a more holistic approach to the subject. Of these programs, Fox News says, “by contrast, studies of comprehensive sex education that support both abstinence and safer sex for sexually active adolescents have found these interventions to be effective at delaying or reducing sexual activity and increasing condom and other contraceptive use” (2019). These findings have been large motivators in recent pushes for more comprehensive sex education. In response to this push, detractors of the idea who advocate for abstinence education criticize comprehensive educational techniques as promoting earlier sexual interactions for younger generations. Fox addresses that by saying “there is no evidence that comprehensive programs hasten the initiation of sexual relations or increase the frequency of sexual activity” (2019). Thus, it seems as though the current scientific community and its subsequent research agree that more comprehensive programs of sex education would be beneficial in better preparing our younger generations to understand the consequences of their decisions and reduce teen pregnancy rates.
Negative Outcomes
It is commonly pointed out that teen pregnancy is considered as being socially undesirable, and that it is a variable that everyone tends to avoid, with some even calling it a “negative outcome” in terms of public health in a society. But why is it classified as such? What aspects of teen pregnancy and its effects make it taboo and to be prevented? The two largest consequences occur within the environment surrounding childbirth and what childbirth means for the future of the mother (Kirby 2007). In regard to the future prospects of the mother, they tend to take less educational opportunities, form larger families, and become single parents with smaller earnings spread among higher numbers of children (Kirby 2007). The situation tends to be even worse for the children of the teen moms, who are born into “less supportive and stimulating home environments, [have] lower cognitive development, worse educational outcomes, higher rates of behavior problems, higher rates of incarceration (sons), and higher rates of adolescent childbearing themselves” (Kirby 2007). Though Kirby does acknowledge that these rates are much higher among 15-17 year olds than 18-19 years, the outlook still seems quite bleak. The largest concern among these outcomes is their self-perpetuating nature. The children of teen mothers tend to also become teen mothers/fathers in their future.
Society must strive for prevention because many teen pregnancies are not the result of a rational choice or decision. In fact, “over 80% of teen pregnancies are unintended” (Marseille 2018). This means that everyone can and should take measures to educate kids, so they know the risks they embark upon, a basic principle that spurs the study into this topic. Of specific programs that attempt to only prevent teen pregnancy, Marseille says, “our findings are consistent with other systematic reviews that have examined the effectiveness of programs aimed at preventing teen pregnancy, finding no statistically significant effect at preventing pregnancy” (2018). This finding would seem to make it clear that a broader approach is necessary to, in some ways, more indirectly tackle the problem of teen pregnancy. Inversely, “they found that interventions with multiple components (educational and contraceptive promoting) had a significant effect in preventing pregnancy” (Marseille 2018). These additional findings would seem to point to more comprehensive and thorough approaches which address the problem of teen pregnancy in a multi-faceted way. Thus, by adding Marseille’s research to the others who have studied the effects of sex education, there is a tentative scientific consensus as to what is most effective in sexual education courses regarding the prevention of teen pregnancy.
Theory and Hypotheses
In linking median household income with teen pregnancy by state, it can be predicted that states with a lower median household income will be more likely to experience higher levels of teen pregnancy. This derives from the thinking that people in lower socio-economic standings will be more likely to experience teen pregnancy. Therefore, if the median household income in a state is lower, then more people in that state have a lower socio-economic standing. Additionally, by correlation between education and income, lower income households tend to be less educated, and less educated people tend to have more children sooner in life. The less educated in the United States may not be fully versed in sexual education, and may not have the resources to educate themselves. Without understanding the consequences of their actions, teens could enter into pregnancies that they did not intend. It is this view of sexual education which suggests that median household income will not have as much impact on the rates of teen pregnancy as the level of sexual education. Though median household income in a state may play a role, it will not have as strong of an impact on teen pregnancy rates as the state’s level of sex education.
States with a lower gross state product (GSP) per capita will be more likely to have higher levels of teen pregnancy. This is because higher income would carry with it socio-economic consequences which would lift people within a state, and overall, the state itself, out of the teenage pregnancy public health crisis. A lower GSP seems to signal lower purchasing power for the average resident and the state as a whole. However, differences in income will have marginal effects on the rates of teen pregnancy and thus GSP per capita will not have as much impact on teen pregnancy as level of sexual education.
States that had higher percentages of support for Donald Trump in 2016 will have higher rates of teen pregnancy. The conservative values possessed by most Trump supporters are commonly expressed in the states which were won by Trump in the 2016 election. Political conservative values beget socially conservative values, one of which pertains to what should or should not be taught in public schools, including sex education. The conservative view tends to lean that abstinence should be the central focus of sex education. The larger point shows that abstinence focused education does not have the intended purpose of reducing teen pregnancy. Thus, it can be presumed that states that voted for Trump will be focused on abstinence education and will keep teen pregnancy rates high or drive it higher. However, it can also be predicted that voting for Trump in 2016 will not decrease teen pregnancy more than the level of sexual education.
States with a lower rate of unemployment will be more likely to have lower teen pregnancy rates. A low rate of unemployment likely signals the healthy economy of a state which speaks to the majority of its well-positioned residents. The link between that well-positioned nature and levels of teen pregnancy would seem to exist, however it is not exceedingly strong. Unemployment rate signals little about the policy favored in terms of abstinence in sexual education, and by itself seems to hold little connection to a state’s rate of teen pregnancy. Except to say that teen pregnancy breeds lower socio-economic outcomes, and the reverse could easily be true, with lower rates of employment signaling conditions in which teen pregnancy rates thrive. Overall, the rate of unemployment will not have as much impact on teen pregnancy as level of sexual education.
As discussed previously, states can be broken down into different classifications which are based on that state’s approach to abstinence education. Breaking states down into degrees of abstinence education allows for further study of these differing groups of states. Rather than just analyzing whether abstinence is present or not, these classifications help us see the effect of abstinence depending on its level of emphasize or inclusion in sex education curriculum. Seeing these degrees of difference can help explain how influential abstinence is in teen pregnancy, and whether that influence changes due to the positioning of and attitudes toward abstinence in a state. Within these classifications, states with more emphasis on abstinence in their curriculum will have higher rates of teen pregnancy.
Data and Methods
This study set out to collect data about the 50 States that could be related to the rate of teen pregnancy in those states. The variables utilized were ones which had the most accurate and complete information available for study. This information was then utilized to analyze the relationships between those variables and teen pregnancy. Additionally, a goal of this study was to show how those variables related to each other in terms of their impact strength on teen pregnancy. Essentially, data was collected with the intention of trying to figure out whether the referenced hypotheses were correct, with an emphasis on trying to figure out what single factor influences teen pregnancy rates the most.
After the data was compiled, an excel spreadsheet was made where both the variables and the units of analysis, the fifty states, could be tracked. The task was approached with an aggregate data design in mind, using the states as the basis of analysis. In studying the states, online articles and publications were utilized from which data could be collected and relationships cemented. The information from these sources and the compiled data was run through SPSS, a statistical software suite used for data management and advanced analytics. This program is able to establish groupings of those states who have similar numbers in similar categories, therefore highlighting potential patterns that can be applied on a larger scale.
The data collected pertains to several factors which could potentially have an influence on the rate of teen pregnancy on a state-by-state level. For each of these factors, data was compiled for all 50 States in order to glean the strength of those connections. The larger purpose of this research is to prove that the strongest connection would be observed through the approach taken to sex education, through comparison with the other variables and their impacts on teen pregnancy. The information pertaining to this study was self-obtained over the last few weeks from the referenced articles, polling sites and studies. Data will be accessed through an Excel spreadsheet and an SPSS file.
No control variables were used as all the variables are independent or dependent. Furthermore, in this kind of a wide-ranging study, a control variable would not be fitting since there are many factors that could play into any variable within this larger project. Anything assumed to be a control variable could easily have one of the other variables mentioned impacting it. All variables discussed are related as they all connect to the condition within the 50 states. They speak to the conditions in which those people in the states live and how those conditions affect the rate of teen pregnancy in the state. The data can confidently be assumed as accurate because it stems from reputable sources such as peer reviewed journals and well respected newspapers. To further validate the data, the sources utilized are not the only source reporting similar numbers and similar conclusions. In this research, there is a building consensus on the matter of sexual education, though all studies vary from this study on their exact mission.
As the data is collected, the intention is to analyze it by breaking it down into further groups of states with similar numbers. Each group is meant to represent a specific hypothesis that is meant to be tested. Once completed, the mean values for each group can be collected which will allow easy comparison where one value is representing multiple states. Additionally, the study will take the full sample size into consideration, so the group’s average may be weighed against the average of the 50 states as a whole. Then those comparisons could be analyzed to see what is revealed about the relationship between a variable and teen pregnancy, and further, how that relationship compares to the level of sex education and rate of teen pregnancy.
The variables are largely interval level because they deal with real numbers that have real consequences for a state. These interval level variables will allow the data to be grouped based on percentage or dollar amount. These groupings will be compared to the ordinal level variable which is a numbering system for classification of a state as it relates to that state’s approach to abstinence education. Importantly, teen pregnancy is expressed as an interval level variable, a percentage. Rather than grouping teen pregnancy, the goal of this study was to draw more exact and precise conclusions on a state by state basis. While there may be some general ideas to take away from the data, such as certain groups of states which are characterized by x variable and will experience y result on teen pregnancy, a broader goal of this study was to explore more exact implications related to teen pregnancy. This will allow the research to further support a general pattern as the mean of a group will be used to study even the outliers within that group to see if they observe the general pattern that can be expected according to previous research in this study.
In analyzing the variables, regression and difference of means were found to be the most appropriate tools. Thus, a regression test was used on each variable pair to find the R square value as well as the significance. The R square value specifically highlights the variance present in how the independent variable impacts the dependent variable. For example, if an R square value was .5, then approximately 50% of the observed variance could be explained by the relationship between the variables. On the other hand, the significance value indicates to what degree the variables are statistically significant. This value tells a researcher whether there is a true relation between variables, or if the test results and the R square value occurred simply by chance. When running these tests and studying the output, one could confirm or deny the hypotheses based on the results. A difference of means test was used on the level of sexual education variables in order to get a clearer picture of the pattern involved in abstinence focused education. The difference of means test grouped the units of analysis and provided a clear picture of the different averages among groups.
In reviewing the output of these tests, patterns began to emerge, and certain benchmarks of variable values were utilized. For the difference of means test, a pattern between each mean as it related to its grouping was sought. Through the difference of means test table output, it was easy to see the developing pattern between group and mean level of teen pregnancy. For regression, the .3 benchmark was utilized for strength. This was essentially positing that an R square value of .3 or higher would signify a strong relationship. Accordingly, a value under .3 would be less strong, and the closer to 0 that the value is, the weaker the variable relationship would then be. This benchmark does not indicate that results under .3 level would be eliminated, but that they would simply be viewed as an indicator of a weak relationship. Any R square value is an indication that something is occurring between the variables and would warrant further study into why the relationship is not as strong as may have been expected. For significance, it was important that the conclusions could be drawn with almost absolute certainty. Because of that, the significance was identified at the .05 level, wherein the conclusions would only be accepted if they had less than a 5% chance of being wrong. Therefore, anything above the 5% threshold would not be accepted due to the unacceptable risk of being wrong due to happenstance or error.
Data Analysis
Figure 1
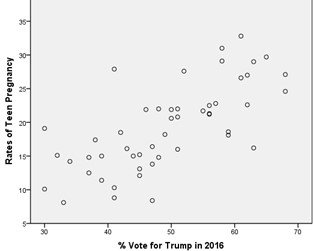
Figure 2
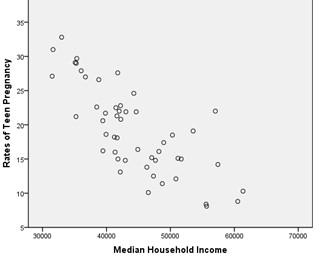
Figure 3
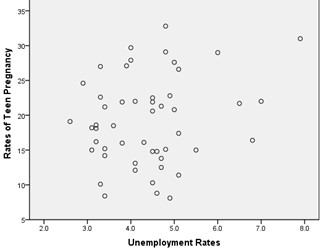
Figure 4
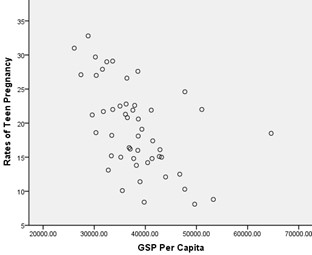
Figure 5
Percentage of Vote for Trump (2016)
Figure 1 shows a clear relationship between the percentage of Trump votes in a state from 2016 and the rate of teen pregnancy in that state. The graph shows a clear trend which is borne out by the data. When running a regression test, the R square value is a strong .489. The size of the variable is a good case for the relationship between Trump votes and teen pregnancy, not only existing, but having a strong relationship. To further solidify the hypothesis as to the relationship of the variables, the significance was almost 0. This is a significant relationship. Due to the strength of the relationship, clear message of the graph, and very low possibility of error, the hypothesis regarding the relationship between the variables should be accepted. This is to say that there is no data indicating that the hypothesis is incorrect, therefore it should be accepted as correct.
Unemployment Rate
Figure 2 however, gives no strong indication one way or another on the relationship between the unemployment rate in a state and that state’s rate of teen pregnancy. The data points are very scattered and seem to have no real trend or direction. Upon analyzing the data with a regression test, the R square value is .045 which registers as a relationship between the variables. However, this relationship would be characterized as quite weak, due to the small R square value. Furthermore, the significance is .139, which is a decent chance of error. These facts lead to the belief that the relationship is insignificant (barring further testing), with the chance of error on an already tenuous relationship being 13.9%. Due to the weak relationship, muddled graph, and higher than acceptable error, the hypothesis will not be accepted and will be found inconclusive for the moment.
GSP per Capita
Figure 3 shows a correlation between the GSP per capita of a state and the teen pregnancy rate in that same state. It is easy to see the trend of the data points, and to know that some sort of relationship is present. Upon further examination, through a regression test, the R square value of the data is .260. This R square value is verging on a relatively strong relationship (using a .3 strength comparison). The R square value presented gives this relationship between variables potential merit and could be cause for further study to find a stronger version of the relationship or widen the sample size even. In analyzing the possibility of finding this relationship in error, the significance value is close to 0. This relationship is very significant and was not found accidentally. Due to the relative strength of the relationship, trends in the graph, and significance of the relationship, the hypothesis will be accepted, with the understanding that a clear relationship does exist.
Median Household Income
Figure 4 illustrates a clear, almost line-like organization of the relationship between median household income in a state and the rate of teen pregnancy in that same state. When a trend such as this is seen on a graph, one can almost imagine the line of best fit running through it, and it is easy to see how strongly these variables may correlate. To back up the appearance of this relationship, a regression test was run which found the R square value to be .584. This is a very strong relationship, undeniably so with that R square value. However, it needed to be ensured that this relationship had not been stumbled upon in error, and when testing for significance, found that the value was close to 0. The relationship is not only very strong, but it is very significant, leaving very little room for error. That small amount of risk is acceptable and given that in combination with the appearance of the graph and the strength of the relationship, This hypothesis will be accepted, as it is the best relationship found in the study thus far.
Level of Sexual Education
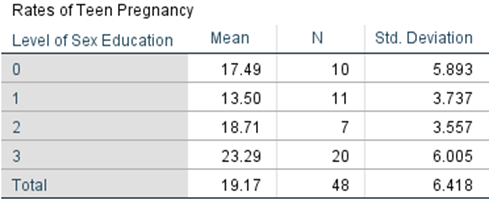
Figure 5 details the levels of sexual education as they relate to abstinence and the mean rates of teen pregnancy in the states corresponding with each level with level 3 being the most emphasis on abstinence in the state law and level 0 being no mention of abstinence at all. Of those in the sample, 2 out of the 50 states did not have relevant data, reducing the sample size to 48. However, within those 48 states, a pattern did seem to emerge. In running a difference of means analysis, the following values were found at the following level: level 0 – 17.49, level 1 – 13.50, level 2 – 18.71, level 3 – 23.29. Due to the descending order from level 3 to level 0 of the mean values, a relationship can be seen between the variables. To determine the strength of that relationship, a regression test was ran which output an R square value of .240. Given the R square value, this relationship has merit and is relatively strong. To confirm the merit of the relationship the significance value was checked which is almost 0. Therefore, the relationship is significant. Overall, the relationship is fairly strong, the table shows a pattern, and there is little chance of error, which pushes this study to accept the hypothesis.
Discussion and Conclusion
Overall, the hypotheses relating percentage of votes for Trump, GSP per capita, median household income, and level of sex education to teen pregnancy rates, was confirmed using states as the units of analysis. The hypothesis linking unemployment rates to teen pregnancy was rejected. In order of strength, from least to most strong, the relationships found were median household income, percentage of votes for Trump, GSP per capita, and level of sex education. These relationships were surprising because these results were not found in previous studies. One potential method for further exploration of these results would be to expand the sample size to include other developed countries. By using this comparison and the additional data sourced from other countries, the findings in America could be further confirmed or possibly refuted.
Another prospective way to continue this research would be to study unemployment rates further, despite that variable being the least impressive in terms of relationship. This study could be furthered by ascertaining what it is about unemployment rates as an economic factor, where the same type of relationship observed through income levels or GSP per capita are not seen. One key question which arose during this study is what makes unemployment rates not a predictor of teen pregnancy rates? This question could possibly be answered by breaking down this study into the people who make up those who are unemployed in a state and if there exists any commonality or pattern between them. Another approach could be in addressing the potential differences between the employment history throughout the life of a teen parent and others who are not teen parents. This comparison could help uncover if there is a relationship between early parentage and employment, as a study of lifespans of individuals, rather than sweeping statistics for states.
This research adds to the field of existing research by confirming relationships found between variables in the past. It has long been known that economic factors have an influence on teen pregnancy, something that was able to be confirmed and isolated. It was also previously understood that emphasis on abstinence did not lead to better teen pregnancy outcomes, which this research further confirmed. An important step in the scientific process is not only trying to find new relationships and variables, but also re-testing work done by others in different ways, which is part of the building of a broader scientific consensus. This research can be directly correlated to the building of a broader scientific consensus.
To discourage teen pregnancy, one should not emphasize abstinence in public school curriculum. In fact, when it comes to discouraging teen pregnancy, several other factors have been found that targets a state’s teen pregnancy rate and reduces it. The study of teen pregnancy and the causes leading to it being a prevalent issue goes much further than simply our countries’ approach to sex or sexual education. It is deeply rooted in political, cultural, and economic factors that can be isolated and targeted for the betterment of all and the reduction of teen pregnancy rates.
References
Fox, Ashley M. et al. 2019. “Funding for Abstinence-Only Education and Adolescent Pregnancy Prevention: Does State Ideology Affect Outcomes?” American Journal of Public Health 109 (3): 497-504.
Kirby, Douglas. 2007. “Abstinence, Sex, and STD/HIV Education Programs for Teens: Their Impact on Sexual Behavior, Pregnancy, and Sexually Transmitted Disease”. Annual Review of Sex Research 18 (1): 143-177.
Leip, Dave & Wasserman, David. 2017. “Presidential Election Results: Donald J. Trump Wins.” The New York Times.
Marseille, Elliot et al. 2018. “Effectiveness of School-Based Teen Pregnancy Prevention Programs in the USA: a Systematic Review and Meta-Analysis”. Official Journal Of The Society For Prevention Research 19 (4): 468-489.
Mckee, Neill. 2008. “Sex Education in a Fractured World: Towards a Social—Ecological Approach.” Brown Journal of World Affairs 14 (2): 213-225.
Santelli, John S. et al. 2019. “Ideology or Evidence? Examining the Population-Level Impact of US Government Funding to Prevent Adolescent Pregnancy.” American Journal of Public Health 109 (3): 356-357.
Steinmetz, John D. 2019. StateMaster. http://www.statemaster.com/statistics.
Stanger-Hall, Kathrin F. 2011. “Abstinence-Only Education and Teen Pregnancy Rates: Why We Need Comprehensive Sex Education in the U.S.”. Public Library of Science 6 (10): 1-11.
World Population Review. 2019. “Teen Pregnancy Rates By State Population.” http://worldpopulationreview.com/states/teen-pregnancy-rates-by-state/.