By: Cody Little
Introduction
The city of York in south central Pennsylvania is a unique and challenging area to study. This is because some parts of the city are littered with million-dollar homes while others house the poorest of the poor. The purpose of this study is to demonstrate how the socioeconomic stratification of an area can inhibit an individual’s ability to succeed in life by creating barriers to higher levels of educational attainment. By exposing the way individuals face different challenges across the city, decision makers will be spurred to act and help those who need it most. To fully understand why this study is necessary, there are some basic demographic information about York which needs to be understood. When looking at the York city area broadly, it is easy to see the effects of inequality. The city itself has a 36% poverty rate compared to about 10% for York County (American Community Survey [ACS], 2016). The racial and ethnic distribution of York County paints a similar picture, with 86.1% of York County residents identifying as White Non-Hispanic, while only 39.4% of York City fall into the same group (ACS, 2016). This indicates that York is a densely populated area having a population consisting of racial or ethnic minorities that face poverty at a rate three times of the surrounding area. This disparity is also indicated in the educational attainment of residents throughout the city. York currently has a high school attainment rate of 78% and a bachelor’s degree attainment rate of 11.9% (ACS, 2017).
Using information from the census bureau combined with theories from political scientists and historians, this study seeks to prove three hypotheses. The first is that York has fallen victim to the idea of “population sorting” made popular by W.J. Wilson in his book, The Truly Disadvantaged. Population sorting is the idea that impoverished individuals clump together in specific areas of a city due to housing and cost of living limitations, while those who are economically better off tend to clump together in their own neighborhoods. To put it simply the first hypothesis is that the city is financially segregated into different neighborhoods. The second hypothesis, which builds from the first, is that there is an unequal distribution of minorities living in the impoverished areas of the city. These residents are more likely to face poverty and other societal ills, such as low educational attainment, than the White Non-Hispanic population. The third, and most important, hypothesis is that those who live in lower socioeconomic areas of the city will achieve lower educational attainment rates than those living in higher socioeconomic areas of the city.
These three hypotheses will be tested by comparing American Community Survey data of York at three different geographic levels; city wide, census tract, and block group. Block groups are clusters of census blocks. Multiple block groups make up census tracts. These three levels of comparison are important as we study different communities and neighborhoods to understand how even the slightest change affects the city. Through gathering data from the Census Bureau from different tracts and block groups within the tracts, we can compare income, race and ethnicity, and educational attainment in order to effectively test the hypotheses. This study seeks to show that different areas of the city face difficulties disproportionately more than others while demonstrating that living in low socioeconomic areas directly impacts a resident’s ability to succeed educationally.
Literature Review
In his book The Truly Disadvantaged, W.J. Wilson began social science research into the communities in which people live. Wilson’s book became a highly debated topic in the policy and political realm. Soon after its publication, he wrote a follow up of his book where he discusses “neighborhood effects” due to the negative impact on future life success as a result of living in impoverish neighborhoods. This research would be expanded on in many fields. Wilson focused his research on why inner cities, which were predominantly minorities, were becoming poorer while areas around the inner city began to flourish. Wilson’s first finding was that the historical discrimination of Black migrants from the Deep South during the early twentieth century had profound and prolonged effects on their ability to succeed economically (Wilson, 1991). This is because, at the time, many African Americans moved to northern cities such as Philadelphia, New York and Baltimore due to the surplus of manufacturing jobs found within them. As the twentieth century progressed into the twenty-first, the United States’ economy became less reliant on manufacturing, and companies found it cheaper to move their warehouses to suburban and rural areas. This left a high density of the African American population in the inner-city neighborhoods with no places of employment.
The mismatch between location of residency and employment proved very difficult for those who could not afford transportation, creating a split between African American communities. Those who were middle class and could afford to travel for employment decided it would be easier to move out of the inner city and closer to work, creating what Wilson described as a “Black Exodus” of successful and financially independent individuals. Since these middle-class African Americans left in order to seek homes closer to their employment, the buffer zone between the impoverished inner city and the economically well-off suburban areas was reduced. (Wilson, 1991). Combining this with what Wilson dubbed “weak labor force attachment,” which is the vulnerability of certain groups to joblessness, inner cities were created that became over a century institutionally impoverished (Wilson, 1991). York faced the very challenges in which Wilson described.
Historically, York was a place where many African Americans sought financial freedom in the early twentieth century only to be disappointed by the loss of manufacturing jobs and generations of discrimination and poverty. These factors led York minorities to become “truly disadvantaged”. This caught the attention of urban policy expert David Rusk, who in 1996 published his study of York evaluating if the city fell victim to the ills described by Wilson. Rusk’s report identified the factors mentioned previously, known as neighborhood effects, to be omnipresent in York.
The negative neighborhood effects usually set in when around 20% of residents live impoverished. Rusk described the phenomenon that when “many poor households are lumped together, a ‘critical mass’ is created” (Rusk, 1996). His previous research also found that 75% of urban poor whites in America do not live in these poor neighborhoods. However, the antithesis is true for minorities such as African Americans and Hispanic and Latinx citizens (Rusk, 1996). Wilson’s and Rusk’s research findings relate to the first two hypotheses that areas of York are financially segregated, and that this segregation disproportionately affects minority residents. Rusk found that in 1990 York had the second highest segregation of schools and neighborhoods in the country and an equally high relative poverty rate between the city itself and the suburbs. His findings also found that York disproportionally had minority citizens living in these “critical mass” neighborhoods of the city facing poverty at a higher rate than White Non-Hispanic residents. He found that 14% of urban poor whites lived in these impoverished neighborhoods while 60% of poor Blacks and 69% of poor Hispanic and Latinx citizens did as well (Rusk, 1996). This means that historically, as short as 30 years ago, York faced the conditions described by the first two hypotheses. Researchers have found this to be true in other urban areas as well. Krieger, Chen, Waterman, Rehkopf, and Subramanian designed a study to determine which geographic areas were the most suitable when studying public health. They came to surprising but unrelated conclusions when analyzing their data (2003). Both their findings on what geographic levels to use when conducting socioeconomic research and poverty concentrations, such as those described by Rusk, are relevant to this study. They found that, in Massachusetts and Rhode Island, half of the white population lived in areas with less than a 5% poverty rate. Meanwhile, over half of the Black and Hispanic population lived in areas with greater than 20% using the same metric (Krieger et. al, 2003). Their research on geographic areas proved insightful as well. The researchers sought to understand how accurate and informational a metric is for socioeconomic research. Their findings concluded that studying at the larger tract level, as compared to the smaller block group or their subdivisions, the block level, proved to be the most accurate when geocoding responses from addresses (Krieger et al., 2003). This finding was considered when designing the methodology of this study. Multiple different geographical parameters to study the city results were used because of the broad range of results it could provide.
Up to this point the literature review has focused primarily on discovering the effects that impoverished neighborhoods have on race and residents’ lives. Now it will shift to the effects of these factors on education. To understand educational attainment, literature will be reviewed regarding children. This is because formal education starts as early as the age of three and can have prolonged effects on later life success. Studies have continuously shown that children from less advantaged households perform more poorly in school than their advantaged counterparts (Ladd. 2012). The hope is that the findings from this research will spur decision makers to make evidence-based decisions when fighting poverty throughout the city by helping to educate those who are disadvantaged. The effects that a lower socioeconomic status has on children and their ability to succeed in education are complex. The first of which comes from health because living in a lower socioeconomic household will affect a child’s health from a very young age, resulting in less development of cognitive abilities (Ladd, 2012). This explains why many government programs such as Women, Infants and Children (WIC), Head Start, and Early Head Start focus on nutrition. A second effect is that, due to housing costs and barriers, many families who live in poverty move more often than more stable middle-class families. The constant uprooting of children and moving them into different educational institutions prevents them from becoming comfortable in their environment and potentially from succeeding academically (Ladd, 2012). While social and financial mobility is usually seen as a positive, this is an instance when it is negative due to resulting from financial constraints. Not only does poverty more negatively impact educational attainment but the opposite is also true. From the time Lyndon Johnson addressed a war on poverty in the early 1970’s, it became clear that much of the focus for combating poverty should be on improving education. Prior research in poverty and educational effects by scholars has found that the higher the level of educational attainment for the head of a household, the lower the probability of the family descending into poverty (Awan, Malik, Sarwar, and Waqas, 2011). Thus, education can be both the root of poverty and the remedy. Government programs and policy analysis to date have built up impressive literature on the topic, but the main take-away is the bilateral connection of poverty and education.
This literature review sought to bridge a gap between different social science disciplines such as urban economics and social psychology. The purpose was to lay the foundation for the theories and methodology to follow. The neighborhood effects described by Wilson and Rusk that are created by variables such as; poverty, education, and unemployment have a real effect on the way individuals living in those communities can succeed and gain education.
Theory and Hypothesis
The first hypothesis put forth in this research is that York has become segregated financially, that is, neighborhoods and communities are segregated along lines of income. This theory falls into the neighborhood effects described by W.J. Wilson previously mentioned in the literature review. The theory behind this hypothesis is that certain areas of the city are sealed off from others due to higher housing costs. These housing costs do not just include rent costs that are higher in one area than another but could also be that certain parts of the city only have homes available to purchase. This provides a financial accessibility barrier for many members of the community in the city. A barrier is created due to the lack of capital among many residents combined with a lack of ability for homeowner loan financing due to poor credit or income history. As seen by Dolan, Peasgoodm, and White, the separation of members of the community from the rest of the city can have negative consequences on their subjective wellbeing (2007). This is most likely caused by a lack of social mobility, or the movement of people and families through different societal social structures. An example would be a York resident not being able to move to a different neighborhood closer to their place of employment because the cost of living is higher there even though it is just down the road.
The second hypothesis discussed in this research is that those living in the lower income neighborhoods segregated from the rest of the city are primarily racial and ethnic minorities. When looking at the overall demographics of the city, many would argue that this would be impossible given that the racial and ethnic distribution of the city is cut into about thirds; one third being White Non-Hispanic, one third being Hispanic or Latinx, and one third being African American. This hypothesis seeks to show that racial and ethnic minorities live in impoverished neighborhoods at a much higher rate than their White Non-Hispanic counterparts, even though there are similar numbers of each racial and ethnic group in the city. This agrees with the findings of David Rusk a quarter century ago. When studying the city of York, Rusk found that two thirds of the African American and Hispanic/Latinx community residents were living in what he described as critical mass centers of poverty within the city, as compared to a measly 14% of White Non-Hispanics. This reaffirms prior research mentioned that was done by Krieger et al., (2003). They found that over half of the African American and Hispanic population in Massachusetts and Rhode Island lived in areas with higher than 20% poverty meanwhile an even fewer 5% of White Non-Hispanics fell into the same category. Theories behind why this happened are mentioned in the literature review by both Rusk and Wilson. Their theories involve the long history of racism and discrimination of minorities in urban areas across the country. The second hypothesis seeks to prove that Rusks earlier assessment of York still holds true and that the long history of discrimination in the urban north still has consequences for racial and ethnic minorities to this day.
The third hypothesis is straightforward. Those with higher educational attainment will be able to receive higher paying jobs or be more exposed to job training. The opposite of this is also true. Those who have lower educational attainment will be less exposed to more educational or employment opportunities, which, in turn, hurts their chances of staying out of poverty. The theory behind using education to fight poverty is a long-term incremental policy initiative. By focusing on education at a young age through early head start or other government intervention programs, the rationale is that over time a compounded effect will be created that leads children out of poverty and into higher levels of education. These children will be less likely to have children at a young age, giving them the financial stability to bring their offspring into the world with the greatest advantage possible; thus, taking a step towards breaking the cycle of poverty. The research done by Ladd et al. exemplifies the strong effects education can have on poverty.
Data and Methods
The methodology used to study the three different hypotheses will each be different, but all will rely on objective data to provide results. The hypotheses will involve: descriptive statistics using data extracted from the United States Census Bureau databases, nonlinear logistic regression, and a Pearson’s Coefficient test of significance. Regarding the first hypothesis, which theorizes that the city is financially segregated, a comparison and contrast of data from each of the sixteen census tracts found within York will be used. The descriptive statistics used here will help to visualize the data. Data was gathered from the 2017 American Community Survey (ACS) including poverty rate and median household income since these are two of the most accurate and commonly used metrics when studying economic wellbeing. This will paint a clear picture of the overall economic status for each census tract within the city and will provide a comparison for each which can be demonstrated through simple bar graphs. The first hypothesis will be tested by discovering economic differences between census tracts and their respective block groups.
The second hypothesis that racial and ethnic minorities live disproportionately in the poorer areas of the city will be tested through very similar means but with different variables. Just as the first hypotheses, data was gathered from the United States Census Bureau databases as well as the 2017 ACS to ensure accuracy and homogeneity. Data will be analyzed using descriptive statistics, a regression model in the form of a logit test, and a Pearson’s Coefficient. The variables of demographic categories and income were analyzed. The demographic variables will be the percentage of population for three different racial and ethnic groups, White Non-Hispanic, Hispanic or Latinx, and African American, in each of the sixteen census tracts and their respective block groups located within York. This will demonstrate whether racial and ethnic groups have become sorted into different areas within the city. This can be compared to the results found from the study of hypothesis one regarding the overall economic status of the census tracts and the smaller block groups in order to find results for hypotheses two. Then the data will be analyzed comparatively through charts and graphs to depict any discovered relationships. A nonlinear logistic regression model will be created to understand the effect a certain percentage of racial or ethnic group living within each block group has on the income of that area. This regression model, in the form of a logit test, will determine if the independent variable can predict the dependent. If it can, this will help prove the second hypothesis by showing a causation between variables. Specifically, this binary logistic regression will attempt to predict whether the income split of a block group is at least 75% of households earning greater than $15,000 and 25% earning less than $15,000 based on the demographic characteristics alone. Generally, if a model can predict outcome around 70% of the time, it is considered accepted.
In this case, the prediction is the dependent variable while the demographic characteristics are the independent variables, or the percentage of residents in each racial and ethnic group mentioned previously. The regression test will give stronger statistical evidence that racial and ethnic minorities live in lower income block groups than descriptive statistics alone. If the test can predict accurately whether a block group will contain at least 75% of households earning $15,000 or more based solely on racial and ethnic proportions and show statistical significance for those racial and ethnic groups, then hypothesis two will be accepted.
A second, more advanced statistical measure will be used to ensure there is a correlation among racial and ethnic groups and income. This will be a Pearson’s Coefficient showing the relationship among two variables on a range from -1 to +1. If the relationship is a negative one, the coefficient will be closer to -1 and if it is a positive, it will be closer to +1. The stronger the relationship, the closer to either -1 or +1 the coefficient will be. In addition, if the significance of these correlations is less than .05, the variables will be considered to matter in statistical analysis. The variable for this test will be the percentage of residents who are White Non-Hispanic and the percentage of households earning higher than $15,000 in each block group. If the results show a number close to +1, then the hypothesis will be doubly accepted because it will mean there is a direct correlation between the percentage of White Non-Hispanics and the percentage of residents’ household income. The third and final hypothesis is that those living in lower socioeconomic status areas of the city will achieve lower educational attainment rates than those living in the higher socioeconomic status areas of the city. This will be discovered by using descriptive statistics similar to the first hypothesis. The primary variables for studying this hypothesis will be the previously mentioned demographic and income data alongside the high school attainment rates for each census tract and block group within the city. The census tracts will be used comparatively with the previous results using descriptive statistics to prove the hypotheses. The block group data will be used for more complex methods, such as the binary logistic regression and Pearson’s Coefficient used in hypothesis #2. The basis of the hypothesis is that even though York City has a high school attainment rate of 78% and a bachelor’s degree attainment rate of 11% those percentages will vary greatly depending on the socioeconomic statuses of census tracts themselves. This will be shown by running a binary logistic regression where the dependent variable will be a 1 or 0 coded response for each census block group. A 1 will be given for any census tracts which have a high school attainment over the city average and a 0 will be given for if it is lower than the city average. The independent variables for this model are the percentage of households earning: less than $15,000, between $15,000 and $25,000, and earning greater than $25,000. Meanwhile, the Pearson’s Coefficient will test for a correlation between the percentage of residents earning below $15,000 in each block group and the high school attainment percentage.
Analysis and Findings
The first hypothesis presented by this research sought to identify if York is segregated financially by analyzing census tracts and block groups within each tract. This hypothesis is accepted. As shown by Chart 1 below, there is a clear demarcation among census tracts when looking at both poverty rates and the median household income. For example, when looking at census tract 7 compared to census tract 8 the difference couldn’t be clearer. Even though geographically these two census tracts are directly next to each other, the economic data of the two are incomparable. Census tract 7 has a poverty rate of 57.9% while census tract 8 has a poverty rate of 14.7%, these are also the highest and lowest rates of poverty among all the census tracts within the city and vary greatly from the city wide 36% poverty rate (ACS, 2017). Comparing the median household income among the census tracts demonstrates the stark difference as well. Census tract 13 has the highest median household with $47,813 annually while census tract 16 has a median household income of only $16,511 (ACS, 2017). This means that the median household income in the highest census tract in York is almost three times as high as the lowest median household income. As of 2017, York has a median household income of $29,834. The results of this first hypothesis show that a city-wide metric of studying poverty or income is insufficient as it does not tell deep enough of the story.
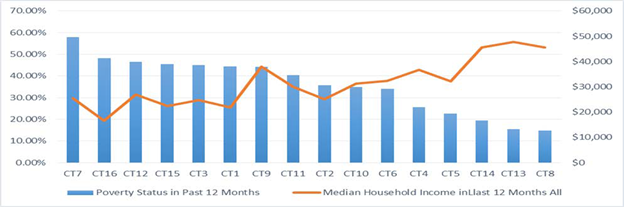
Chart 1. ACS 2017
Just as a city-wide metric of understanding economic variables is too broad, more information can be gathered when looking at individual block groups within each census tract. Chart 2 below depicts the percentage of households falling into specific income brackets for the census tracts with the two highest and lowest median household incomes. Census tracts 13 and 14, which have the highest median household incomes both have an overwhelming majority of their households earning greater than $25,000 annually, while in the census tracts with the lowest incomes this is not the case. Block groups 1 and 2 of census tract 16 even have a higher percentage of their households earning less than $15,000 annually than those earning more than $25,000 (ACS, 2017). Among the poorest block groups in York, one can see that one half of the total households earn less than $25,000 annually. By looking at the block group levels of economic data below we can see that, not only is York financially segregated at the census tract level, but it becomes even more disparate when we look at the block groups for analysis.
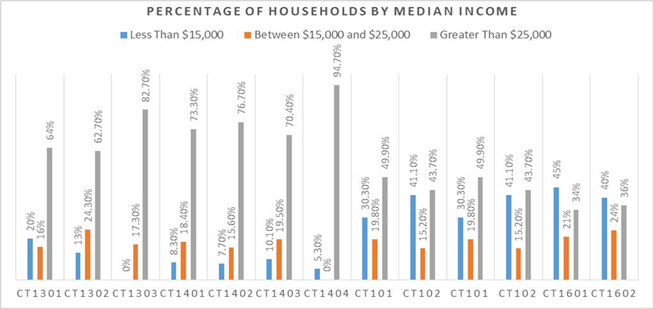
Chart 2. ACS 2017
A potential argument against this hypothesis is that York may only be financially segregated when looking at the two ends of each extreme, the richest and poorest. This is not the case as depicted by Chart 3 below. It shows the block group median household income breakdown for census tract 11. Census tract 11 was chosen because it represents the most moderate of census tracts economically with a median household income almost exactly the same as the city as a whole ($29,834 vs. $29,917) and a poverty rate which is just higher than the city total (36% vs. 40%). Even among a seemingly normal census tract the economic disparity persists. Over half of Block group 1’s households earn less than $15,000 a year.
Meanwhile, this metric for the three other block groups within this tract are much lower. Chart 3 shows that financial segregation within the city happens even at the block group level among the most average census tracts. The data analyzed for this report indicates the acceptance of hypothesis one because it shows there are clear economic differences between the census tracts of York and disparity among the block groups within each census tract.
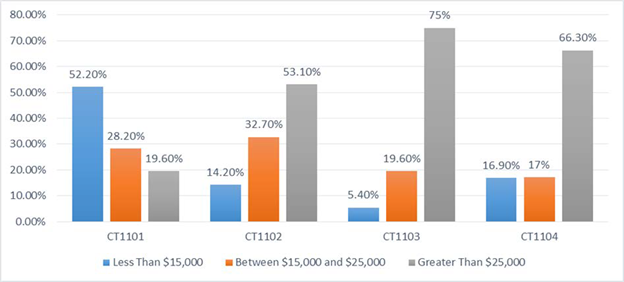
Chart 3. ACS 2017
The second hypothesis that even though York is comprised of two thirds racial and ethnic minorities as residents, they disproportionately live in the lower income and more impoverished areas discovered in the first hypothesis. Chart 4 depicts the racial and ethnic group breakdown by households for all 16 census tracts within York. As shown, there are no broad conclusions that can be drawn from this information. Without hypothesis #1 discovering which areas of the city were the best and worse off economically, hypothesis #2 would be a moot point.
Chart 4. ACS 2017
Chart 5 depicts the racial and ethnic group breakdown by household for the 3 lowest poverty census tracts. Census tracts 8, 13, and 14 are predominantly filled with households that are White Non-Hispanic. From this we can draw the conclusion that racial and ethnic minorities are the least likely to live in the economically advanced areas of the city
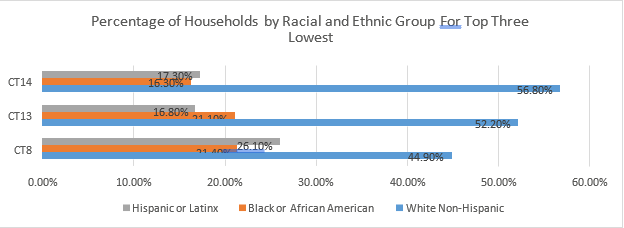
Chart 5. ACS 2017
This finding also holds true when we look at the inverse. In the three census tracts which have the highest rate of poverty we can see in Chart 6 that the racial and ethnic breakdown by household paints a much different picture. While racial and ethnic minorities do not make up an overwhelming majority of the population in tracts 16, 7, and 12, the stark difference between Charts 5 and 6 show the disparity.
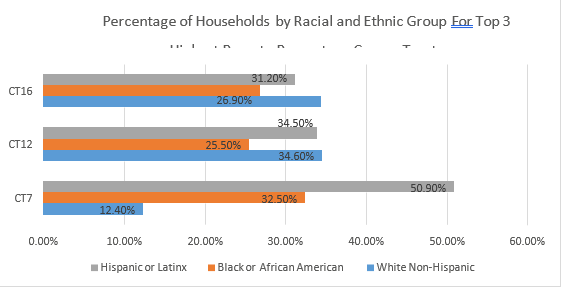
Chart 6. ACS 2017
While the data given for the census tracts prove hypothesis #2, further investigation into the actual block groups of York is necessary to create an undeniable acceptance for the hypothesis. When comparing the block groups of the city by household income, even more economic disparity by racial or ethnic group comes to light. Chart 7 shows the top five highest earning block groups in York. This was determined by what percentage of households earn more than the $25,000 threshold. In the top five highest earning block groups all but one are a majority of White Non-Hispanic households. In block group 4 of census tract 14, the highest earning block group in the city, over 80% of households are White Non-Hispanic. In this block group 94% of households earn greater than $25,000 annually, as shown in Chart 2.
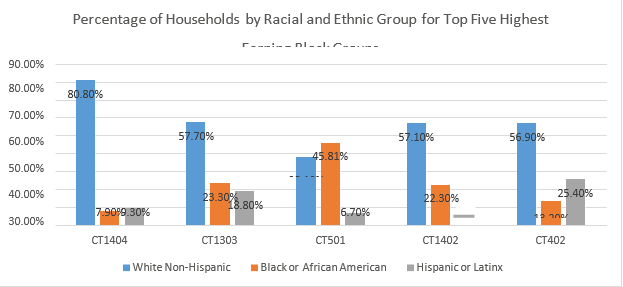
Chart 7. ACS 2017
When looking at the inverse of this the results are striking. To determine the lowest earning households the data was analyzed in order to determine which block groups have the highest percentage of households earning less than $15,000 annually. Chart 8 depicts the percentage of households, by racial and ethnic group, in the block groups with the highest percentage of households earning less than $15,000 a year. Clearly, racial and ethnic minorities are much more likely to live in these block groups than the ones mentioned in Chart 7. To put this comparison in perspective, the lowest earning block group in the city, census tract 5, block group 3, contains only 20.2% of households earning more than $25,000 annually, as compared to tract 14, block group 4, which has 94%.
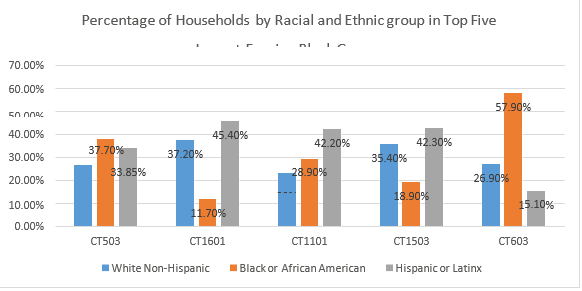
Chart 8. ACS 2017
The results of the binary logistic regression give a stronger mathematical foundation to these findings. A null hypothesis model that did not include any of the independent variables was done to ensure accuracy. The results showed no effect on the dependent model. The classification table below shows the prediction done by the logit test. Given the three independent variables, the regression model can predict the propensity of a block group having at the least a 75/25% split of median household income where the 75% earn $15,000 or greater annually at 68.9%. This means by simply using the independent variables, the model can predict the dependent ones 68.9% of the time.
Classification Table
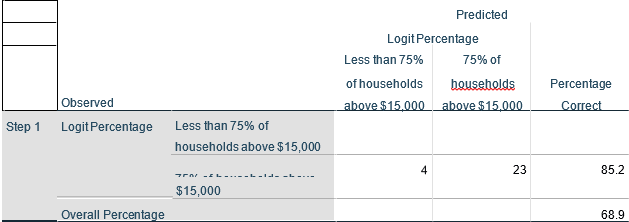
The logit test also shows which variables had a significant effect on the test leading it to predict its results. As shown by the data window below, both the Percentage of African Americans and the Percentage of Hispanic or Latinx citizens meet statistical significance at an a of .01. The significance level for percentage of African American residents was .070 and the significance for Hispanic or Latinx residents was .084. These results strengthen the case for accepting hypothesis #2 because they show that identifying Hispanic or Latinx, as well as African American, can affect whether households have an income above or below $15,000.
Variables in the Equation
| B | S.E. | Wald | df | Sig. | Exp(B) | ||
| Step 1a | Percentage White Non- Hispanic | -10.902 | 7.920 | 1.895 | 1 | .169 | .000 |
| Percentage African American | -15.287 | 8.451 | 3.272 | 1 | .070 | .000 | |
| Percentage Hispanic or Latinx | -14.076 | 8.153 | 2.981 | 1 | .084 | .000 | |
| Constant | 12.859 | 7.627 | 2.842 | 1 | .092 | 384342.243 |
- Variable(s) entered on step 1: Percentage White Non-Hispanic, Percentage African American, Percentage Hispanic or Latinx.
More evidence can be found when looking at the results of the Pearson’s Coefficient test to show the relationship between two variables. As shown by the data window below, the correlation is .421**, which is deemed very significant. The correlation of .421** means that there is a positive relationship between earning more than $15,000 in a household and being White Non-Hispanic. The 2-tailed significance level of the test is .004, which is significant at the very high a threshold of .005. The Pearson’s test of correlation shows an incredibly strong relationship between the percentage of White Non-Hispanic residents and the percentage of residents earning more than $15,000 in a block group.
Correlations
| Percentage Greater Than $15,000 | Percentage White Non- Hispanic | ||
| Percentage Greater Than $15,000 | Pearson Correlation | 1 | .421** |
| Sig. (2-tailed) | .004 | ||
| N | 45 | 45 | |
| Percentage White Non- Hispanic | Pearson Correlation | .421** | 1 |
| Sig. (2-tailed) | .004 | ||
| N | 45 | 45 |
**. Correlation is significant at the 0.01 level (2-tailed).
Given the combination of results from the descriptive statistics, binary logistic regression model, and Pearson’s Coefficient, we can accept hypotheses #2 as true. The created logit model can predict with near 70% accuracy, as accepted in the discipline of political science, whether or not a block group will reach a threshold of 75% of households earning $15,000 or more annually based solely on the percentage of racial and ethnic groups within it. The Pearson’s Coefficient shows a .004 significance and a coefficient of.421, giving the impression that the percentage of White Non- Hispanic households is strongly related to the percentage of households earning more than $15,000. The results of the test show that as the percentage of residents who are White Non-Hispanic in a block group rises, so does the percentage of households earning more than $15,000.
The third and final hypothesis is that those living in lower socioeconomic tracts of the city will achieve lower educational attainment rates than those in higher tracts. Descriptive statistics will be used to prove this hypothesis true. To demonstrate, Chart 9 below depicts the educational attainment rate of each census tract compared to the poverty rate. It is clear to see that there is a correlation between poverty and education in York. As the Chart moves from left to right the poverty status rises while the educational attainment lowers.
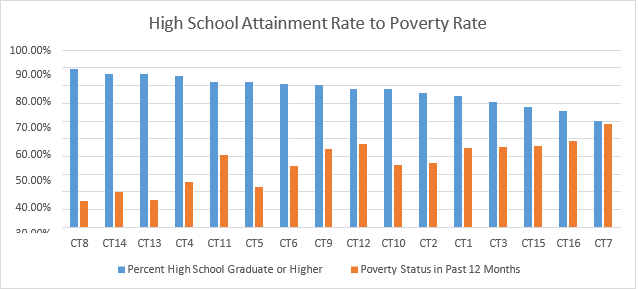
Chart 9. ACS 2017
When looking at the distribution of income as compared to educational attainment rates the results are unequivocal, as indicated in Chart 10. The census tracts with the highest educational attainment earn nearly double the census tracts with the lowest educational attainment. For example, tract 16 has a 65% high school attainment rate and a $16,511 median household income while tract 13 has an 86% attainment rate and a $47,813 median household income. This is strong evidence that those living in impoverished neighborhoods throughout York are at a much greater disadvantage, both economically and educationally, than those who live in higher socioeconomic areas of the city.
| Percent High School Graduate | Median Household Income | |
| CT7 | 60.00% | $25,446 |
| CT15 | 67.60% | $22,357 |
| CT16 | 65.40% | $16,511 |
| CT8 | 89.10% | $45,515 |
| CT13 | 86.10% | $47,813 |
| CT14 | 86.20% | $45,598 |
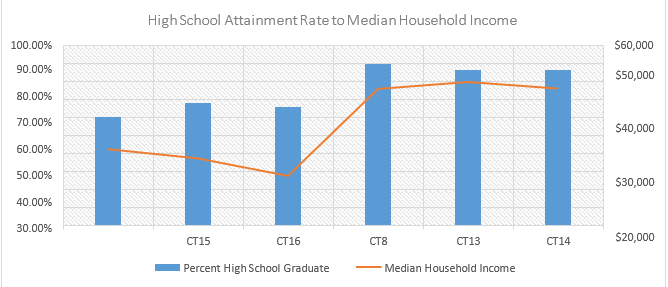
Chart 10, ACS 2017
The results become more muddied when the data is analyzed to determine if racial or ethnic groups face lower educational attainment rates by census tracts. For the city as a whole, White Non-Hispanics fare the best for high school attainment with 82.1%, while African Americans are 79.4%, and Hispanic and Latinx residents are 70.6%. It could be imagined that the racial and ethnic minorities living in the impoverished neighborhoods described in the two previous hypotheses would also face lower educational attainment in the respective census tracts as well. Chart 11 below depicts the high school attainment rate and the percentage of residents who identify as White Non-Hispanic. As we can see the data varies greatly and there is no discernable trend.
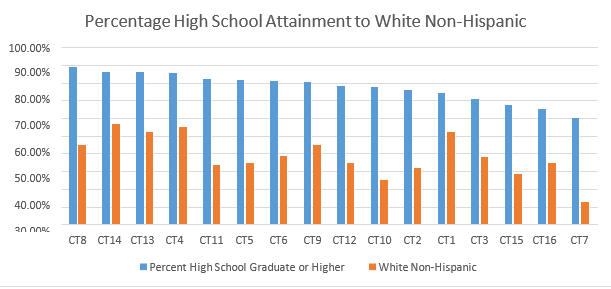
Chart 11, ACS 2017
If we instead take a different approach such as identifying the three highest and lowest census tracts by educational attainment it the results become prosaic. As Chart 12 below shows, the three census tracts (Tracts 8, 13, and 14) with the highest educational attainment also have high percentages of their population being White Non-Hispanic. Meanwhile the census tracts with the lowest educational attainment rates (Tracts 7, 15, and 16) have lower portions of their residents being White Non-Hispanic. The lowest census tract in regards to high school attainment in the city is tract 7 which has a meager 60% but its residents are primarily racial and ethnic minorities with only 12.4% identifying as White Non-Hispanic.
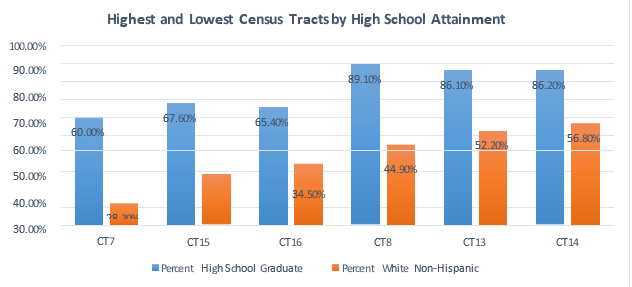
Chart 12. ACS 2017
When looking at the results of the binary logistic regression model one can see below that the model can predict with again 68.9% accuracy if a block group will have a high school attainment higher than the city average based on the independent variables of percentage of households in different earning brackets. It can also predict with 80% accuracy if the observed outcome of having higher than a city-wide average is prevalent. The variables in the equation table were not included in the final analysis because none of the three variables had a significant effect on the outcome of the model.
Classification Table
| Predicted | ||||
| Logit Percentage Education | Percentage Correct | |||
| Less Than City Wide High School Observed Attainment | Greater Than City wide high school attainment | |||
| Step 1 Logit Percentage Less Than City Wide Education High School Attainment | 10 | 9 | 52.6 | |
| Greater Than City wide high school attainment | 5 | 21 | 80.8 | |
| Overall Percentage | 68.9 | |||
When looking at the Pearson’s Coefficient, a test was run to identify a correlation between educational attainment in a block group and the percentage of households earning under $15,000 a significant relationship is found. The Pearson’s R category shows a -.352* relationship. This means that as the percentage of households within a block group earning less than $15,000 increases as the percentage of residents who achieve a high school attainment level or high decreases. The two-tailed significance is .018 which is less than .05, meaning that the relationship is statistically significant.
Correlations
| Percentage Less Than $15,000 | Percentage High School and GED Attainment | ||
| Percentage Less Than $15,000 | Pearson Correlation | 1 | -.352* |
| Sig. (2-tailed) | .018 | ||
| N | 45 | 45 | |
| Percentage High School and GED Attainment | Pearson Correlation | -.352* | 1 |
| Sig. (2-tailed) | .018 | ||
| N | 45 | 45 |
*. Correlation is significant at the 0.05 level (2-tailed).
Given the clear connection between poverty and income in addition to the fact that racial and ethnic minorities live proportionally more in tracts with lower educational attainment, this research accepts the third and final hypotheses. The binary logistic regression model can predict accurately if a block group has higher or lower than the city-wide high school attainment rate based solely on the percentage of households within an income bracket. The Pearson test also gives more statistical robustness because of the significance level and inverse relationship between severely impoverished households and the educational attainment rate for a block group.
Discussion and Conclusion
This research sought to prove three things about York. That it is financially segregated, this financial segregation affects racial and ethnic minorities proportionately more than White Non-Hispanics, and the racial and financial segregation affects educational attainment rates. Given the basic descriptive statistics in conjunction with the more advanced regression model and Pearson’s two-tailed test of significance, all of these hypotheses are accepted at a fundamental level. The connection between lower income areas, racial and ethnic groups, and educational attainment rates within York are anything but opaque. The results show that current attempts at combatting poverty through education are failing residents of this city, especially those who are racial and ethnic minorities. Given the model’s ability to predict an income split with 68.9% propensity one can accept that racial and ethnic minorities are far less advantaged than their counterparts. In a city where two thirds of the residents are either African American or Hispanic and Latinx this is absolutely unacceptable. At the most fundamental level this study sought to show how very different the lives of individuals can be a few blocks from each other within the same city. These descriptive statistics shown by the graphs and the regression model can illuminate the socioeconomic inequalities that persist in York, Pennsylvania in a mathematical and accurate fashion.
References
Awan, S. R., Malik, N., Sarwar, H., Waqas, M., (2011) Impact of Education on Poverty Reduction. MPRA Paper No. 31826. Retrieved From: https://mpra.ub.uni-muenchen.de/31826/1/MPRA_paper_31826.pdf
Dolan, P., Peasgoodm T., White, M., (2007) Do We really Know what makes us happy? A review of the economic literature on the factors associated with subjective wellbeing. Journal of Economic Psychology. Vol. 29, No. 1, pp. 94 – 122. Retrieved From: https://www.sciencedirect.com/science/article/pii/S0167487007000694
Krieger, N., Chen, J. T., Waterman, D., Rehkopf, D. H., Subramanian, S. V., (2003) Race/Ethnicity, Gender, and Monitoring Socioeconomic Gradients in Health: A Comparison of Area-Based Socioeconomic Measures – The Public Health Disparities Geocoding Project. American Journal of Public Health. Vol 93., No.10, Retrieved From: https://ajph.aphapublications.org/doi/pdfplus/10.2105/AJPH.93.10.1655
Ladd, H. F., (2012) Presidential Address: Education and Poverty: Confronting the Evidence. Journal of Policy Analysis and Management, Vol. 31, No. 2 pp. 203-227 Retrieved From: https://www.jstor.org/stable/pdf/41429276.pdf
Rusk, D. (1996) the Rusk Report. York Daily Record. Wednesday November 20, 1996. Retrieved from: https://moodle.ycp.edu/pluginfile.php/627864/mod_resource/content/1/rusk-report.pdf
U.S. Census Bureau. (2016 and 2017). United States Census Bureau American Community Survey. Retrieved From https://www.census.gov/programs-surveys/acs
Wilson, W, J., (1991) The Truly Disadvantaged Revisited: A Response to Hochschild and Boxill.
Ethics, Vol. 101, No.3, pp. 593-609 Retrieved From: https://www.jstor.org/stable/pdf/2381471.pdf