By: Ty Schumacher
Introduction
The ever-growing importance of the news media must be considered when analyzing any facet of American society, which is why today, the vast majority of Americans cannot go a single day without consuming at least one piece of news media. Combining the extreme level of media consumption with the shift of news media from simply reporting news to guiding news and setting the public agenda, the news media is more important now than ever. In a poll completed by Statista, it was found that people spent on average 473 minutes per day consuming different types of media. This is 7.88 hours, a little less than a third of the day. Furthermore, 470 of those minutes were devoted to digital media, with only three minutes being devoted to things such as reading physical newspapers (“Topic: Media Use In The U.S.” 2021). This same poll also found that people in 2021 averaged 12 paid monthly media subscriptions (“Topic: Media Use In The U.S.” 2021). Now, these 7.88 hours are certainly not devoted entirely to the consumption of news media, but news media has its way of slipping into every facet of media consumption. Between pop-up ads, commercial advertisements, politically geared posts and much more, the news media is able to easily reach people who are not seeking to consume news media.
Because this news media is sneakily reaching its audience, it is able to subconsciously convince people of things quite easily. This has been exemplified by the harsh anti-immigration rhetoric shared by Republicans since 2016. A Gallup poll found that in 2015, only 40% of people thought the United States should cut back on the number of immigrants allowed into the country (“Immigration” 2020). But in 2019, at the height of Donald Trump’s first presidency, it was found that almost 60% of people thought the United States should cut back on the number of immigrants allowed into the country (Gallup 2020). This phenomena of news media influence has also been seen in other aspects of American society, such as the massive increase in Anti-Muslim hate crimes following 9/11. A study by The 9/11 Memorial Museum found that hate crimes against Muslims jumped a staggering 1000% from 2000 to 2001, and stayed at those massive heights for years following 2001. The museum hypothesizes that a large number of these hate crimes stemmed from the representation of Muslims in the media post 9/11 (“Muslims In America After 9/11, Part II | National September 11 Memorial & Museum” 2019). Because of the multitude of observed connections between the news media and public opinion, this paper sets out to determine how the representation of 9/11 and the subsequent war on terror by the news media impacted public opinion of the war on terror.
Literature Review
The vicious attacks seen across the East Coast of the United States of America on September 11th, 2001 will always be one of the most pivotal moments in American history. Everything seemed to change the moment the first tower was struck. The most drastic and noticeable change came in the form of the Transportation Security Administration (TSA), an agency within the then recently-created Department of Homeland Security created to make airline travel safer. Over fifty thousand people were employed by this administration in a year, and the entire process of air travel shifted drastically. Suddenly, “tickets and photo IDs became required to get through the screening area. Laptop computers and electronics had to be removed from carry-on bags. Shoes were taken off. Liquids were restricted to three-ounce containers” (Roos 2021), and full body scanners became commonplace. Agents from the TSA trained in behavioral detection were placed in every airport, and a terrorist watchlist of hundreds of thousands of people was created. Many people on this list were even placed on a shorter “no fly” list, which included 500 Americans. (Roos 2021). The changes did not stop at airlines though. Americans saw an increased police presence around every mode of transportation, and in public spaces.
The tangible changes which followed 9/11 were vast, but the unseen changes which followed were even more drastic. These intangible changes can be summed up by American public opinion which saw a large spike in patriotism and support for President Bush. In the wake of 9/11, the Pew Research Center found that “79% of adults had displayed an American flag” (Hartig and Doherty 2021). Furthermore, public polling showed that “62% of Americans often felt patriotic as a result of the 9/11 attacks” (Hartig and Doherty 2021), which was exemplified by strange actions, such as restaurants beginning to offer freedom fries instead of French fries as a patriotic response to France’s opposition to the Iraq War (Dew, 2003) Another important poll to note following the events of 9/11 is that “60% of adults expressed trust in the federal government – a level not reached in the previous three decades” (Hartig and Doherty 2021). This trust in the federal government was equally reflected in the approval polls for George W. Bush following the event, with “86% of Americans approving his handling of the job, 96% being Republicans and 78% being Democrats” (Hartig and Doherty 2021). This was the highest approval rating George W. Bush received during both terms, and one of the highest seen by any president. The sentiments shifted by 9/11 were not just based in politics. Four months after the events of 9/11, 78% said religion’s influence in American life was increasing, more than double the share who said that eight months earlier (Hartig and Doherty 2021).
The tragic events of 9/11 certainly brought Americans together and created a more unified country, which was seen through polling, but that did not last forever. In fact, “the “9/11 effect” on public opinion was short-lived”, with “public trust in government, as well as confidence in other institutions, declining throughout the 2000s” (Hartig and Doherty 2021).
This decline was likely seen because of how America responded to 9/11: the war on terror. The war on terror stemmed from what is now known as the Bush Doctrine, which became the blueprint for the aforementioned war. When Bush announced his new doctrine and subsequent war, he stated “Our war on terror begins with al Qaeda, but it does not end there. It will not end until every terrorist group of global reach has been found, stopped, and defeated” (Bush 2010). This phrase spoken by Bush led America down its 20-year path of involvement in the Middle East. It is the basis of the Bush Doctrine, which has three main points. These points included preventative war, unilateral action, and the spread of freedom. All sections of the Bush Doctrine were ideas the American people originally supported, but that came to change as the doctrine was actually implemented.
The first country which America entered in an attempt to wipe out terrorism was Afghanistan. By late 2003, the main bodies of the terrorists’ groups had seemingly been captured, killed or had fled the country. This allowed the United States to begin reconstruction. Unfortunately, it quickly became apparent that a multilateral attempt was not working, so the United States took over unilaterally. The reconstruction budget was almost doubled overnight, and upwards of 30,000 troops were sent into the country to oversee reconstruction. For a multitude of reasons, reconstruction was never truly accomplished (Gregg 2020). The United States left forces in Afghanistan until the middle of 2021, almost a full 20 years after entering, yet the country’s government still seemingly collapsed the moment America fully withdrew.
The second country which was directly impacted by the Bush Doctrine was Iraq. This war was ultimately considered “a war of choice rather than a war of necessity” (Gregg 2020). Many believe that to be the case because the United States entered the country due to the notion that Iraq possessed weapons of mass destruction. This claim, however, was quickly found to be false, although the question of whether the Bush Administration was knowingly lying, simply misinformed, or some combination of both, is subject to heated debate. Regardless of these findings, the United States had managed to create another country with no functioning government, and so had to begin reconstruction. Approximately 20,000 troops were deployed to Iraq, where they ended up acting as hall monitors, patrolling the street to enforce peace (Gregg 2020). In the end, the United States was able to create a government which agreed to diplomatic relations with the United States, but US troops still remained in Iraq until 2011.
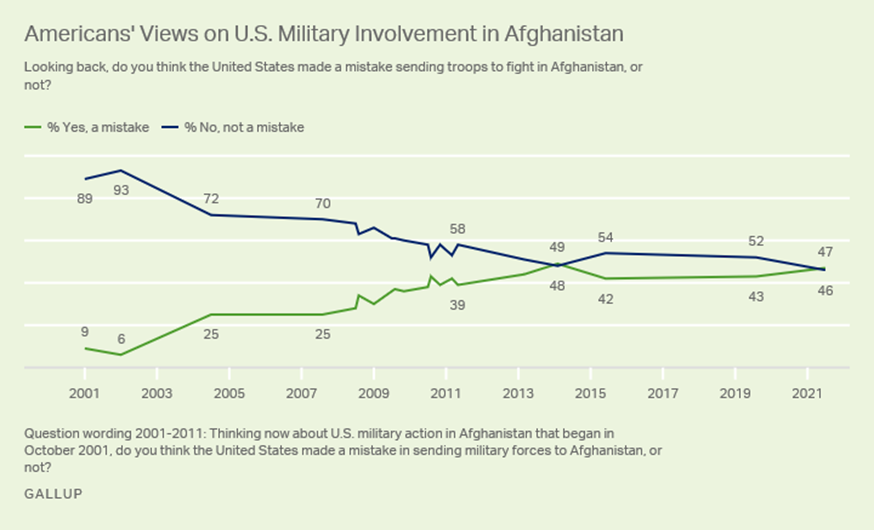
Although The Bush Doctrine was meant to address the situation in the Middle East in a fast and effective way, the war on terror continued for years. The American people did not expect to be bogged down in a twenty-year war that would ultimately end with America losing lives and money, and gaining nothing tangible. These feelings are seen quite easily in the public approval ratings of the war on terror as time went on. What started as something supported by almost all of America quickly became something hated by a majority. A question quickly emerged: what caused this massive cultural shift? Some hypothesize that it could have been the length of the war, but there is a possibility that it was caused by the portrayal from the news media.
Many believe that it is the job of the news media to simply report what is occurring, and that may have been the case years ago. But in reality, it is often up to the news media to frame what is occurring to convince viewers to share the opinion of the news outlet. This phenomena of news media setting public opinion is studied in the article, “When Can a News Organization Lead Public Opinion?: Ideology Versus Market Forces in Decisions to Make News”. In a four-pronged experiment utilizing the various components of the news media, the researchers found a set of necessary conditions for the news media to be leading public opinion. These conditions include “the audience pays the opportunity cost associated with attending a news report, the audience holds prior beliefs that contradict the news report, the report utilizes the report to further their career goals, and the report is included because it matches the ideology of the business from which it is being reported” (Bovitz, Druckman and Lupia 2002). This study shows that the news media is not always responsible for swaying public opinion, but it does possess the ability to do so. The article also hypothesizes that news outlets are able to make more money when the mentioned conditions are met, which means news outlets have a vested interest in being opinion leaders. However, that theory has not been tested thoroughly.
There have been multiple studies which examine to what extent the news media can influence public opinion, but for the purposes of this study, three in particular take precedence. The first study, titled “Notes on a (Sex Crime) Scandal: The Impact of Media Coverage of Sexual Abuse in the Catholic Church on Public Opinion”, focused on the impact of news media and the Catholic Church. This study was completed via randomized telephone polling, utilizing both land lines and cell phones. Around a thousand respondents were reached, with 75% of them identifying as non-Catholic and 25% of them identifying as Catholic (Mancini and Shields 2014). These respondents were asked about their confidence regarding the Catholic church’s ability to prevent sexual crime, given a piece of media to consume, and then asked again about their confidence in the Catholic church’s ability to prevent sexual crime. The most important finding of this study is that “Catholics and non-Catholics who perceived the coverage as positively biased were significantly more confident that the Church could effectively respond to sex crime allegations in the future” (Mancini and Shields 2014). This is incredibly important to note, because respondents recognized that the media was attempting to influence them, yet still allowed themselves to be swayed in the direction of the news media.
The second study pertaining to the extent of the influence news media has on public opinion, titled “Television News, Public Opinion, and the Iraq War: Do Wartime Rationales Matter?”, was completed by Kevin Coe for the Sage Journals. This study focused on how the portrayal of the war in Iraq influenced public opinion in America. The study focused on six identified rationales for being involved in the war, “tracking the number of times they were used in television news during the period immediately preceding a survey respondent being asked if the Iraq War was “worth it” (Coe 2012). The results of the study showed that, as a whole, the rationales for war were able to perpetuate increased public support for the war when used as a whole. However, “the results show that none of the rationales produced a substantively meaningful change in predicted support” (Coe 2012) when utilized alone. Both studies presented, regarding the influence of the news media, prove that certain bias and portrayal can certainly impact public opinion, but it is not a guarantee that every article influences every viewer.
The final study, titled “All the News You Want to Hear: The Impact of Partisan News Exposure On Political Participation”, was completed by Susanna Dilliplane for the Public Opinion Quarterly. This paper focused on the influence of partisan viewership on public opinion. In the study, respondents selected through random digit dialing were interviewed five separate times to see how partisan viewership directly correlated to the opinions they formed regarding events in America. One important finding of Dilliplane’s research is that “Republicans and Democrats equally like to watch likeminded news” (Dilliplane 2011). The end results of the study proved that respondents were much more likely to be swayed by news media they considered to be partisan towards their own party. Therefore, a Republican was more likely to be convinced by conservative news while a Democrat was more likely to be convinced by liberal news. This seems to be common sense. However, the study showed that respondents could be swayed by news media biased towards their party even if the news media was portraying something with which they initially disagreed. This finding is incredibly important to note because it shows people placing partisanship above their own convictions.
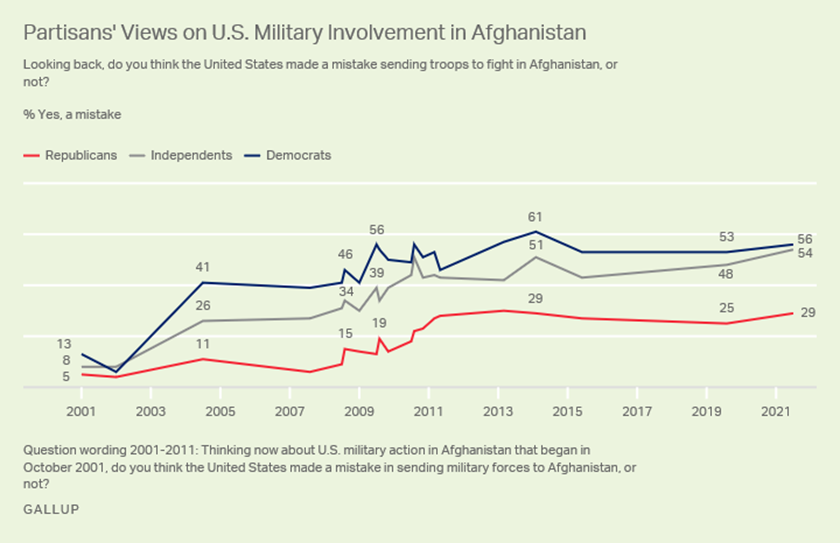
As proven by the Gallup polls conducted following 9/11, American public opinion was incredibly influenced. The facets influenced varied greatly, from political opinions to personal beliefs. By linking the rapidly decreasing public approval of the war on terror as it took unexpected twists and turns with the established notion that the news media does not just have an impact on public opinion, but actively tries to lead it, this study can then delve into the question of how the news media impacted the public approval ratings for the war on terror. In fact, with the established influence of partisan news viewership, this paper can go a step further and study how the partisan portrayal of the war on terror impacted specific political groups. By doing so, this research intends to further the studies completed by Dilliplane and Coe by combining the tenets of their research. Dilliplane looks into media self-selection and how party identification can lead to the formation of public opinion, while Coe focuses on how specific media consumption forms public opinion. This research seeks to answer the following question: how does party identification in media self-election lead to the formation of public opinion?
Hypotheses
The goal of this paper is to determine the correlation between the media portrayal of the war on terror and the overall public sentiment towards the war on terror. Every single policy decision in the United States has had both proponents and opponents, and the war on terror is no exception. From its inception in the early 2000’s, the vast majority of Americans supported it while only a small minority opposed it. However, during its twenty-year tenure, that paradigm shifted to the majority of Americans opposing it and only a small minority supporting it. According to the Pew Research Center, in 2003 71% of Americans surveyed believed that the US had “made the right decision” in using military force in Iraq while only 22% believed it was the “wrong decision.” By 2018 only 43% believed that the use of military force in Iraq had been the right decision with 48% believing it had been the wrong decision [insert citation here]. Major media outlets went from showcasing the war on terror in a positive light to showcasing it in a negative light. Because of this change occurring while the shift in the paradigm of support occurred, one can hypothesize that these are connected in some way. Through simply observing the spikes and dips in public support of the war on terror, it appears that they could also be correlated with the partisanship of the president at a given time. The research question which emerges from the previous research and aforementioned trends is as follows: the change in public approval towards the war on terror is influenced by partisan portrayal from the news media, with partisan portrayal leading to direct correlation for those identifying with the lean of the news media, no correlation for those identifying opposite the lean of the news media, and some correlation for those not identifying with partisanship. With the basis of the research question, three hypotheses are seen to emerge. They are separated according to political party identification, or lack thereof.
Hypothesis #1: The continued primarily positive portrayal of the war on terror by conservative leaning news sites from its inception in 2001 to 2007 and the subsequent portrayal shift to negative from 2008 to 2016 led to continued public support of the war on terror from Republicans while it was being portrayed positively, and led to waning public support from Republicans when it was being portrayed negatively.
Hypothesis #2: The continued primarily positive portrayal of the war on terror by conservative leaning news sites from its inception in 2001 to 2007 and the subsequent portrayal shift to negative from 2008 to 2016 had no direct impact on the public support from Democrats while it was being portrayed positively and while it was being portrayed negatively.
Hypothesis #3: The continued primarily positive portrayal of the war on terror by conservative leaning news sites from its inception in 2001 to 2007 and the subsequent portrayal shift to negative from 2008 to 2016 led to continued public support of the war on terror from Independents while it was being portrayed positively, and led to waning public support from Independents when it was being portrayed negatively.
Data & Methodology
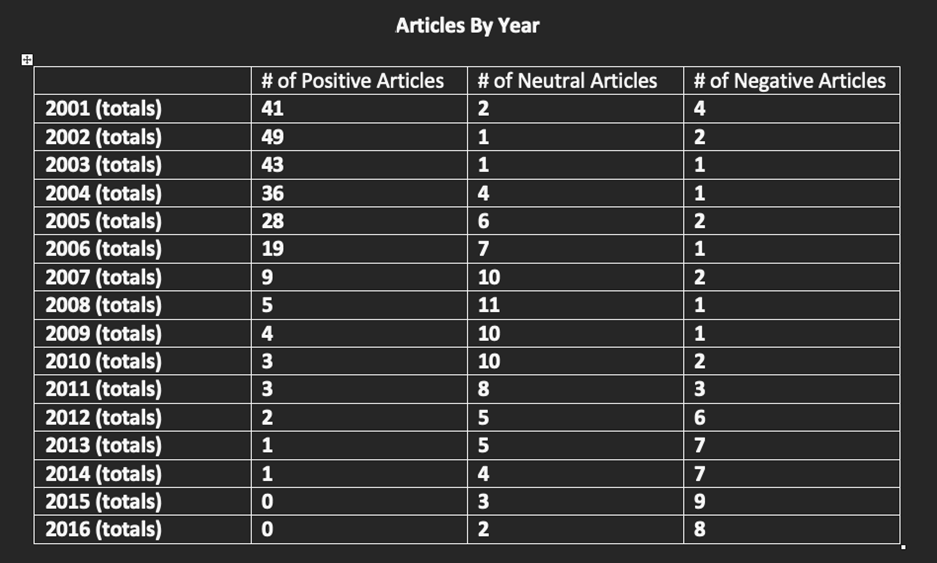
The data utilized for this study is two-pronged. The first set of data needed is the public approval ratings for the war on terror from its onset to its end. The second prong of data is the media portrayal of the war on terror during specific years. The first set of data necessary is compiled from polling centers in the United States. The most prevalent polling completed regarding this topic comes from Gallup Polls, which is a recognized and non-partisan source for public opinion polls. The second, and arguably more important data set concerns the media portrayal of the war on terror. Because the research question brings to light partisanship, the Wall Street Journal was specifically chosen because it was the conservative leaning newspaper with the highest viewership during the time period (2001-2016). Allsides, a media bias identifier, has consistently ranked The Wall Street Journal as conservative leaning. Because of this, the study focuses on the approval rating as reported by those self-identifying as conservative. The purpose of selecting an inherently biased newspaper was to further the study completed by Dilliplane regarding partisanship self-selection. Studies have shown that the likelihood of an individual viewing news media with a potential bias that disagrees with their own bias is incredibly slim. Instead of attempting to code data to cancel out this phenomena, it makes more sense to utilize data which continues this already observed phenomena. This newspaper has archive sites available to the public (“The Wall Street Journal Archives (2001-2016)” 2001). This archive site was quantified to create a data set able to be utilized in the statistical analysis software SPSS, or the Statistical Package for the Social Sciences. The goal of the data gathering was to analyze all news articles published by the news site related to the war on terror in the specific years relevant to this study. A news article was considered to be a commentary on the war on terror if it mentioned a set list of word combinations in the title. This list of word combinations was war on terror, war in Iraq, war in Afghanistan, 9/11 response, United States in the Middle East, or any other combination of those specific words not listed. If an article had some of these words present in the title but was not obviously a piece regarding the war on terror, it was not included. Articles labeled as op-eds, or “Opposite Editorial” pieces were not included as they do not always represent the view of the newspaper. These news articles were sorted into three categories: positive, negative and neutral to provide a usable data set. These categories were defined by adjective usage to ensure consistency.
The measure of positive, negative or neutral was defined by the inequality of adjectives used in reference to America present in the news article. The number of positive adjectives present in each news article was counted. A positive adjective was defined using a list of adjectives from yourdictionary.com. The sampling of the positive adjectives is as follows: affectionate, agreeable, amiable, bright, charming, creative, determined, diligent, diplomatic, dynamic, energetic, friendly, funny, generous, giving, gregarious, hardworking, helpful, imaginative, kind, likable, loyal, patient, polite, sincere (Betts 2022). A full list is provided in the appendix section. Any adjective that would be considered a synonym to one of the words on the list according to Merriam Webster was also counted towards the positive adjective count (Merriam Webster 2022). A negative adjective was also defined using a list of adjectives from yourdictionary.com. The sampling of the negative adjectives is as follows: aggressive, arrogant, belligerent, bigoted, blunt, callous, critical, cynical, dishonest, distant, envious, greedy, guarded, hostile, indifferent, intolerant, irresponsible, jealous, pessimistic, prejudiced, prideful, resentful, rude, sad, selfish, skeptical, suspicious, thoughtless, unemotional, untrusting (Betts 2022). A full list is provided in the appendix section. Any adjective that would be considered a synonym to one of the words on the list according to Merriam Webster was also counted towards the negative adjective count (Merriam Webster 2022). Yourdictionary.com was utilized because it provided a framework for adjectives sorted into positive and negative categories. Merriam Webster was utilized because it represents a more complete representation of all words available in the English lexicon.
As the majority of news articles published during the specified time period contained both positive and negative adjectives, guidelines had to be set to sort each article after adjective calculations were made. If an article contained five more positive adjectives than negative adjectives, it was sorted as a positive article. If an article contained five more negative adjectives than positive adjectives, it was sorted as a negative article. If the difference between positive and negative adjectives was less than five, it was defined as a neutral article. If an article did not contain anything that could be considered a positive or negative adjective according to the criteria set, it was not included in the study. Furthermore, an article was considered an article concerning the war on terror if it contained 9/11, terrorism, Iraq, Afghanistan, war on terror or another similar phrase, it was considered an article about the war on terror. The described criteria were set to ensure that the data set concerning positive or negative articles was as consistent as possible. All citations for the archive sites utilized are present at the citation section of the study.
Both data sets described above were compiled into SPSS, a statistical analysis software. The second data set which had three parts, classification of articles as positive, neutral or negative, was then manipulated to decide if the year as a whole was positive, neutral or negative so as to be one singular variable. To reach this conclusion, the number of both negative and neutral articles for the year were subtracted from the number of positive for the year. If the final number was positive, the year was a positive year. If the final number was zero, the year was a neutral year. If the final number was negative, the year was a negative year. This classification made them nominal variables. These data points which were now classified as the summation of positive or negative for the year were analyzed in comparison to the approval rating of the war on terror, which is an ordinal variable. When considering the purpose of the study, which is to decide the strength of correlation between media portrayal of the war on terror and the American approval rating of the war on terror, the most effective method of analysis was a regression test. The regression test was used to find the R square value, which is a measure of the variation of a variable, as well as the significance for each variable pair. These values helped showcase the strength of relation between variables as well as the probability of error within the tests.
When studying the outputs of the regression tests, patterns were identified, and certain benchmarks were used for variable values. A .3 benchmark was utilized during the regression tests to identify strength. Anything with an R square value that was .3 or higher was flagged to represent a stronger relationship. Therefore, an R square value that was less than .3 was flagged as representing a weaker relationship, which would deteriorate further according to how close the R square came to 0. This is not to say that test results that had an R square value lower than .3 were thrown out, but any conclusions made utilizing those tests did acknowledge the weaker relationship present. Furthermore, because these tests with a weaker relationship still showed a relationship of sorts, the question about why these relationships were weak was brought up. In terms of a significant value, the significance level chosen was identified at the .05 level, which is to say that the only tests which would be accepted to draw conclusions from would have a five percent or less chance of being incorrect. Therefore, anything with a significance level greater than .05 was not accepted because of the risk of being wrong due to chance or error.
The data and methodology provided for this study have resulted in a comprehensive understanding of how a conservative newspaper influenced the public opinion of primarily conservative viewers as well as, to a lesser extent, liberal and independent viewers regarding a war which occurred under two presidents. This study does, however, have a wide range of limitations. The first is that it is only testing for conservative views as influenced by conservative media. These results could potentially be extrapolated to guess how liberal views were influenced by liberal media, but the results could not be applied with any level of certainty. This also applies to voters who label themselves as moderate or independent. There is no way to even hazard a guess as to how the results of the study could be applied to them. Another limitation is that only one news outlet, albeit a very popular one, was used in the study. This assumes that all respondents to the Gallup poll utilize the specific news outlet, which is very unlikely. A final limitation, which does not stem from the selected data, is time. When a country is involved in a war, it is very common for approval ratings to dip as the war drags on. Usually, the longer the war, the lower the approval ratings. There is a possibility that any observed phenomena stems from the passage of time, not from the influence of the news media.
Data Analysis
Figure 1.1
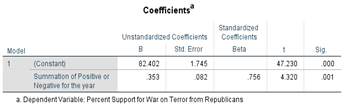
Figure 1.2
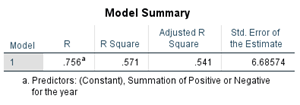
Figure 1.3
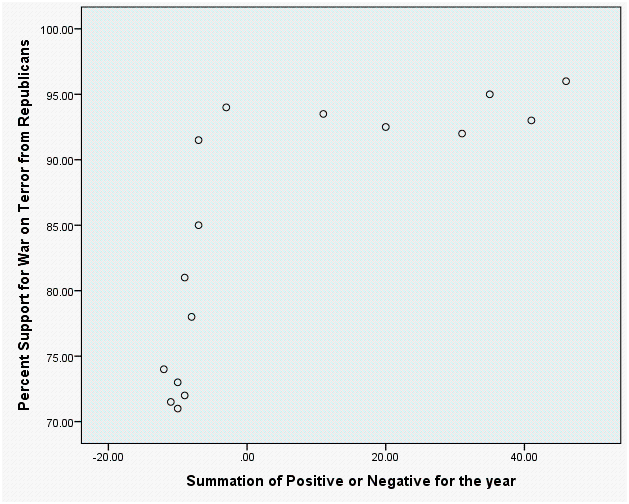
Figure 2.1
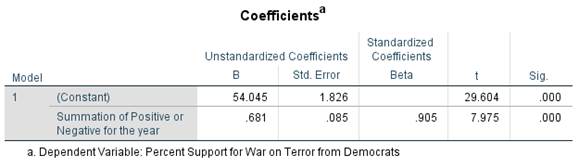
Figure 2.2
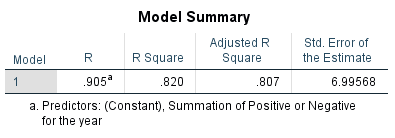
Figure 2.3
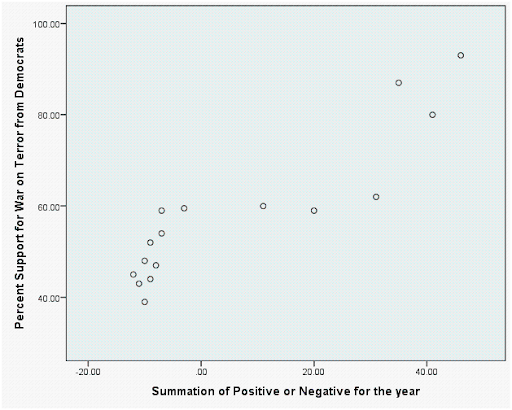
Figure 3.1
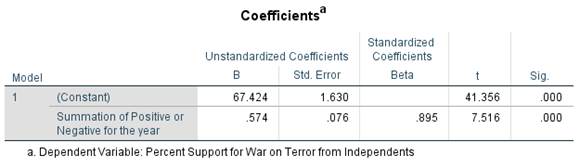
Figure 3.2
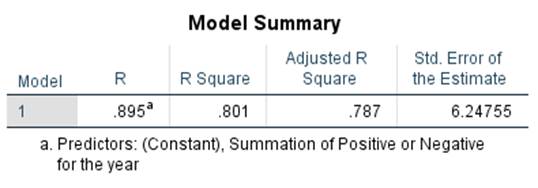
Figure 3.3
Hypothesis #1
The scatter plot shown in figure 1.3 represents the relationship between the media portrayal of the war and the Republican support of the war. The pattern seen in the scatter plot showcases a clear trend that positive articles regarding the war on terror lead to more positive opinions from Republicans regarding the war on terror, and that negative articles regarding the war on terror lead to more negative opinions from Republicans regarding the war on terror. The regression analysis results are shown in both figure 1.1 and figure 1.2. The R-square value, which is shown in figure 1.2, is .57, therefore indicating a close relationship between these variables. Furthermore, because of the incredibly high value of the R-square, the relationship is found to be very strong. Figure 1.1 shows that the significance value for the regression test regarding the influence of the media portrayal of the war on Republican support of the war is .01. This significance value is under the .05 limit, which means there is a proven relationship between the media portrayal of the war and the Republican support of the war. Therefore, the regression test leads to the acceptance of Hypothesis #1, proving that the reporting bias of conservative news media directly influences the opinions of Republicans.
Hypothesis #2
The scatter plot shown in figure 2.3 represents the relationship between the media portrayal of the war and support of the war among members of the Democratic Party. The pattern seen in the scatter plot showcases a clear trend that positive articles regarding the war on terror lead to more positive opinions from Democrats regarding the war on terror, and that negative articles regarding the war on terror lead to more negative opinions from Democrats regarding the war on terror. The regression analysis results are shown in both figure 2.1 and figure 2.2. The R-square value, which is shown in figure 2.2, is .82, therefore indicating a close relationship between these variables. Furthermore, because of the incredibly high value of the R-square, the relationship is found to be incredibly strong. Figure 2.1 shows that the significance value for the regression test regarding the influence of the media portrayal of the war on Republican support of the war is .00. This significance value is under the .05 limit, which means there is a proven relationship between the media portrayal of the war and the Republican support of the war. However, the hypothesis regarding the relationship between conservative media portrayal and Democrat support of the war on terror stated that there would be no relationship between these variables. Because of the proven relationship, the regression test leads to the rejection of hypothesis #2.
Hypothesis #3
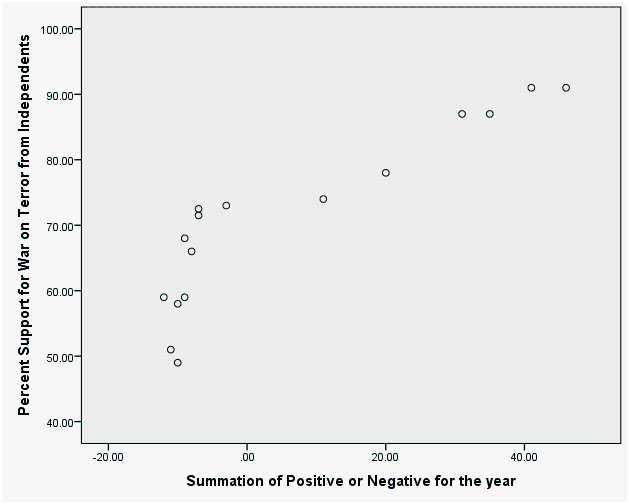
The scatter plot shown in figure 3.3 represents the relationship between the media portrayal of the war and the Independent support of the war. The pattern seen in the scatter plot showcases a clear trend that positive articles regarding the war on terror lead to more positive opinions from Independents regarding the war on terror, and that negative articles regarding the war on terror lead to more negative opinions from Republicans regarding the war on terror. The regression analysis results are shown in both figure 3.1 and figure 3.2. The R-square value, which is shown in figure 3.2, is .80, therefore indicating a close relationship between these variables. Furthermore, because of the incredibly high value of the R-square, the relationship is found to be incredibly strong. Figure 3.1 shows that the significance value for the regression test regarding the influence of the media portrayal of the war on Independent support of the war is .00. This significance value is under the .05 limit, which means there is a proven relationship between the media portrayal of the war and the Independent support of the war. Therefore, the regression test leads to the acceptance of hypothesis #1, proving that the reporting bias of conservative news media directly influences the opinions of Independents.
Discussion and Conclusion
The results of this research study are both expected and surprising. The expected parts stem from hypothesis #1 and partly from hypothesis #3, which were proven to be true by the regression analysis. Hypothesis #1, which states that conservative biased media portrayal of the war on terror would directly correlate with approval ratings from Republicans, was found to be true with a high level of significance and a strong relationship. This was not surprising, as previous studies have found that people utilize the media to form their public opinions. Furthermore, studies have found that self-selected media consumption directly correlates to the public opinion held by those consuming the media. That is to say, Republicans consume conservative news media because it will lead them to an opinion with which they are happy.
Hypothesis #3, which states that conservative biased media portrayal of the war on terror would directly correlate with approval ratings from Independents, was found to be true with a high level of significance and an incredibly strong relationship. The hypothesis being proven true is somewhat surprising, as previous studies show that Independents should not be as swayed by conservative news media because they do not wholly identify with it. The strength is incredibly shocking, as it is stronger than the relationship seen by conservative media and Republicans. These results could likely be explained by the polarizing impact that 9/11 and the subsequent war on terror had on the United States. Independents are often very centered in their belief, but the shocking events of 9/11 could have driven those identifying as Independent towards the conservative side of the spectrum.
The most shocking part of this research is the fact that Hypothesis #2, which stated that the conservative biased media portrayal of the war on terror would have no impact on approval ratings from Democrats, was proven to be untrue. The regression analysis showed a very high significance level, and a relationship as strong as media portrayal for Independents. According to previous studies completed regarding media influence on partisan viewers, conservative media should have absolutely no impact on Democrat support. This phenomena could have occurred for a few reasons. The first is the extreme polarization previously mentioned in discussion regarding Independent’s shift. Democrats could have experienced that as well. The other, more likely explanation is that the liberal leaning news media which was consumed by Democrats at the time also followed the pattern of a positive to negative shift in portrayal. A third explanation for this phenomena is that Democrats are much more influenced by the news media than Republicans. A study completed by Pew Research polls in 2020 gauged which news sites were most trusted by each party. One of the graphs in this poll showed only news sites which were trusted by at least 33% of the party respondents showing the news sites with the most trust among All American Adults, Democrats/ Independents who lean Democratic, and Republicans/Independents who lean Republican. The results for Republicans only included 2 news sources, with the highest trust level being Fox News which was trusted 65% of Republican respondents and respondents who lean Republican, while Democrats indicated that they trusted a staggering thirteen news sources, with the highest trust level being CNN which was trusted by 67% of Democratic respondents and respondents who lean Democratic (“Democrats Report Much Higher Levels Of Trust In A Number Of News Sources Than Republicans” 2020). This massive disparity between Republicans and Democrats regarding widespread trust of the news media could easily indicate that Democrats are more influenced, and therefore explain the results of this study. Interestingly, this Pew Research Poll shows that at least 38% of Democrats and Independents who lean Democratic reported The Wall Street Journal as an outlet they trusted despite it being a more conservative outlet, showing that news reported by The Wall Street Journal may have influenced some liberal/Democratic reader’s opinions on the war (“Democrats Report Much Higher Levels Of Trust In A Number Of News Sources Than Republicans” 2020). Although this Pew Research poll does not include data regarding independents, it is possible that varying levels of trust in the news media could also explain the results for their study.
As the results of this study expectedly verify one hypothesis, unexpectedly negates another hypothesis, and falls in the middle for the third hypothesis, it is incredibly important to identify what issues may have existed in this study. The first and most probable issue, which was already briefly mentioned, is time. It is very common for support of a war to wane as the war drags on, which the war on terror certainly did. Instead of the falling approval ratings being caused by the consumption of biased news media, it could have been caused by the passage of time. Americans may have become tired of the war and therefore stopped approving of it. Another issue with this study is that it cannot be proven that Americans consumed the pieces of news media used for this study. It is assumed the pieces of news media were consumed as they were printed by the highest grossing conservative newspaper, but that does not guarantee that it is true.
Although there are issues with this research design, it can lead to future avenues of research. The first avenue of research would be to run this study again but include data sets from both independent news sites and liberal news sites. These further studies could be used to show if Independent opinions and Democrat opinions follow the bias of their respective news media as well as Republicans follow the bias of their own news media. By coding data for Independent and liberal news sites, it could also be seen if the shift from positive to negative portrayal stems solely from the passage of time. If it bears out that each political identity is equally influenced by their respective media’s bias in terms of the war on terror, the studies done by Dilliplane and Coe will be further supported. If it bears out that the shift from positive portrayal to negative portrayal stems solely from the passage of time, the results can be used for future research involving public opinion ratings of war. A final avenue of research would be to explore the results of the Pew Research poll regarding trust in the news media. Including that data in a study regarding influence of the news media could result in findings that identify which, if any, party is more greatly influenced by the news media.
Although the results of this research study are unexpected and the study itself has flaws, it still adds beneficial information to the study of news media. It proves that at least in the case of 9/11, conservative media bias directly impacts the public opinion of Republicans. It also can be used to support the claim of extremely polarizing events leading to uniform public approval ratings regardless of partisanship. This is shown by the results of hypothesis #2 and hypothesis #3. This research provides a baseline for defining news articles as positive or negative. It also opens up the door to further explore how each party sees the media, and how each party is influenced by the media from their own party as well as the media from the opposing party. The other thing that this research does is to help inform Americans of the power the news media holds over them. Americans need to be aware of this power that the news media holds so that they do not let it fully influence them. To be a free and educated electorate, Americans must form their own opinion, and must be aware that the news media is attempting to do that for them, which is highlighted by this research.
Appendix A: List of positive words taken from yourdictionary.com:
Affectionate, loving, adoring, fond, agreeable, pleasant, harmonious, amenable, amiable, friendly, polite, kind, bright, intelligent, smart, intellectual, charming, creative, artistic, imaginative, inventive, determined, persistent, stubborn, single-minded, diligent, persistent, hard-working, industrious, diplomatic, tactful, gracious, strategic, dynamic, charismatic, energetic, vital, energetic, vigorous, vivacious, lively, friendly, affable, companionable, amicable, funny, hilarious, amusing, comical, generous, big-hearted, charitable, considerate, giving, generous, big-hearted, bountiful, gregarious, affable, friendly, convivial, hardworking, industrious, diligent, zealous, helpful, beneficent, supportive, accommodating, kind, affable, good, compassionate, likeable, agreeable, friendly, amiable, loyal, faithful, committed, devoted, patient, enduring, tolerant, forbearing, polite, courteous, civilized, cordial, sincere, genuine, honest, heartfelt, amazing, astounding, stunning, fascinating, awesome, amazing, awe-inspiring, outstanding, blithesome, lighthearted, carefree, gleeful, excellent, wonderful, superior, exceptional, fabulous, wonderful, awesome, phenomenal, favorable, agreeable, supportive, encouraging, fortuitous, accidental, unexpected, serendipitous, gorgeous, handsome, exquisite, good-looking, incredible, marvelous, inconceivable, amazing, unique, singular, individual, unparalleled, mirthful, merry, carefree, gleeful, outstanding, superior, excellent, magnificent, perfect, flawless, faultless, impeccable, philosophical, flawless, faultless, impeccable, propitious, auspicious, advantageous, promising, remarkable, unusual, impressive, noteworthy, rousing, enthusiastic, spirited, chirpy, spectacular, awesome, breathtaking, dazzling, splendid, luxurious, excellent, illustrious, stellar, cosmic, outstanding, superior, stupendous, wonderful, fabulous, marvelous, super, great, magnificent, terrific, upbeat, cheerful, buoyant, rosy, stunning, beautiful, gorgeous, dazzling, wondrous, astonishing, extraordinary, miraculous
References
Betts, Jennifer. 2022. “List Of 125+ Positive Adjectives.” Grammar.yourdictionary.com. https://grammar.yourdictionary.com/parts-of-speech/adjectives/list-of-positive-adjectives.html (5 May 2022).
Betts, Jennifer. 2022. “Words That Describe Negative Attitudes” Grammar.yourdictionary.com. https://grammar.yourdictionary.com/word-lists/words-that-describe-negative-attitudes.html (5 May 2022).
Bovitz, Gregory, James Druckman, and Arthur Lupia. 2002. “When Can A News Organization Lead Public Opinion?: Ideology Versus Market Forces In Decisions To Make News.” Jstor. https://www.jstor.org/stable/30025776?pq-origsite=summon&seq=3 (5 May 2022).
Brannon, Megan. 2021. “Americans Split On Whether Afghanistan War Was A Mistake.” Gallup.com. https://news.gallup.com/poll/352793/americans-split-whether-afghanistan-war-mistake.aspx (5 May 2022).
Bush, George W. 2010. Decision Points. New York: Random House.
Coe, Kevin. 2012. “Television News, Public Opinion, And The Iraq War: Do Wartime Rationales Matter?.” Sage Pub. https://journals-sagepub-com.ezproxy.ycp.edu:8443/doi/full/10.1177/0093650212438916?utm_source=summon&utm_medium=discovery-provider (5 May 2022).
“Democrats Report Much Higher Levels Of Trust In A Number Of News Sources Than Republicans.” 2020. Pew Research Center’s Journalism Project. https://www.pewresearch.org/journalism/2020/01/24/democrats-report-much-higher-levels-of-trust-in-a-number-of-news-sources-than-republicans/ (5 May 2022).
Dew, Spencer, 2003. “Freedom Fries”. University of Chicago Divinity School. https://divinity.uchicago.edu/sightings/articles/freedom-fries-spencer-dew
“Dictionary Home Page.” 2022. Merriam Webster. https://www.merriam-webster.com (5 May 2022).
Dilliplane, Susanna. 2011. “ALL THE NEWS YOU WANT TO HEAR: THE IMPACT OF PARTISAN NEWS EXPOSURE ON POLITICAL PARTICIPATION.” Jstor. https://www.jstor.org/stable/41288385?pq-origsite=summon&seq=13 (5 May 2022).
Gottfried, Jeffrey, and Naomi Forman-Katz. 2021. “More Americans Now See The Media’S Influence Growing Compared With A Year Ago.” Pew Research Center. https://www.pewresearch.org/fact-tank/2021/05/17/more-americans-now-see-the-medias-influence-growing-compared-with-a-year-ago/ (5 May 2022).
Gregg, Gary. 2020. “George W. Bush: Foreign Affairs | Miller Center.” Miller Center. https://millercenter.org/president/gwbush/foreign-affairs (5 May 2022).
Hartig, Hannah, and Carroll Doherty. 2021. “Two Decades Later, The Enduring Legacy Of 9/11.” Pew Research Center – U.S. Politics & Policy. https://www.pewresearch.org/politics/2021/09/02/two-decades-later-the-enduring-legacy-of-9-11/ (5 May 2022).
“Immigration.” 2020. Gallup.com. https://news.gallup.com/poll/1660/immigration.aspx (5 May 2022).
Mancini, Christina, and Ryan Shields. 2014. “Notes On A (Sex Crime) Scandal: The Impact Of Media Coverage Of Sexual Abuse In The Catholic Church On Public Opinio.” Sciencedirect.com. https://www-sciencedirect-com.ezproxy.ycp.edu:8443/science/article/pii/S0047235213000457?via%3Dihub#s0045 (5 May 2022).
“Muslims In America After 9/11, Part II | National September 11 Memorial & Museum.” 2019. 911memorial.org. https://www.911memorial.org/learn/students-and-teachers/lesson-plans/muslims-america-after-911-part-ii (5 May 2022).
Reese, Stephen, and Seth Lewis. 2009. “Framing The War On Terror: The Internalization Of Policy In The US Press.” Journalism UTexas. https://journalism.utexas.edu/sites/default/files/framing-war-on-terror-sagepub.pdf (5 May 2022).
Roos, David. 2021. “5 Ways 9/11 Changed America.” HISTORY.COM. https://www.history.com/news/september-11-changes-america (5 May 2022).
Schmidt, Brian, and Michael Willaims. 2008. “The Bush Doctrine And The Iraq War: Neoconservatives Versus Realists.” Taylor & Francis. https://www.tandfonline.com/doi/full/10.1080/09636410802098990 (5 May 2022).
“The Wall Street Journal Archives (2001-2016).” 2001. WSJ. https://www.wsj.com/news/archive/years (5 May 2022).
“Topic: Media Use In The U.S..” 2021. Statista. https://www.statista.com/topics/1536/media-use/ (5 May 2022).
Addendum
Data Sets